
Abstract:
Urban malaria in Ethiopia’s highland regions is an emerging public health concern influenced by climate variability, human mobility, and ecological shifts. Although Addis Ababa was historically considered low-risk due to its elevation, recent trends indicate expanding transmission and rising case numbers. This study examined socioeconomic, demographic, and ecological determinants of malaria in Addis Ababa’s urban highlands.
A cross-sectional survey of 654 outpatients from five randomly selected sub-cities was conducted using a semi-structured questionnaire. Data were analyzed through descriptive, bivariate, and multivariate logistic regression analyses, with diagnostic tests including VIF, Cronbach’s alpha, and the Hosmer–Lemeshow test.
Malaria prevalence was 9.6%, dominated by Plasmodium falciparum (81%). Key predictors were male sex (AOR: 2.63, p=0.011), travel to endemic areas (AOR: 7.77, p<0.001), agricultural activity near homes (AOR: 2.16, p=0.033), and low education. Knowledge and behavioral gaps were notable: 63.3% showed poor understanding of malaria, and 81.2% lacked effective prevention practices. Environmental factors such as ITN ownership and housing quality were not significant, suggesting imported cases dominate local transmission.
Malaria control in Addis Ababa should prioritize traveler screening, community education, and integrated urban surveillance to address growing urban malaria risks.
1. Introduction
Malaria remains a significant public health problem in Ethiopia, one of the sub-Saharan African countries with diverse transmission patterns and varying endemicity across ecological zones. The country experiences seasonal malaria transmission influenced by geographic and climatic variability. In response, the Ethiopian government launched the National Malaria Strategic Plan (2021–2025), aiming to reduce malaria morbidity and mortality by 50% relative to 2020 levels, eliminate indigenous malaria in districts with an Annual Parasitic Index (API) below 10, ensure universal testing of suspected cases, treat all confirmed cases, and implement comprehensive vector control interventions for all at-risk populations by 2025.[1]
Achieving these ambitious targets requires robust health system readiness and context-specific strategies that align with national and subnational priorities.[2] Recent epidemiological data from the Addis Ababa Health Bureau (2023) indicate a concerning rise in malaria cases since 2020, with a notable peak in late 2023. Moreover, the geographic distribution of cases has expanded into previously unaffected or low-incidence districts, suggesting shifts in transmission dynamics potentially driven by climate variability, urban expansion, changes in vector ecology, and human mobility. In response, the Bureau initiated a multifaceted public health intervention encompassing enhanced surveillance, environmental management, community education, and clinical sensitization.[3]
Given these emerging trends, a comprehensive understanding of malaria determinants is essential, spanning epidemiological, behavioral, environmental, and socioeconomic dimensions. Recent scholarship emphasizes the importance of interdisciplinary approaches integrating social, economic, and health system factors to inform effective malaria control and elimination strategies.[4]
- Literature review
Despite a growing body of literature on malaria prevalence in Ethiopia, significant gaps and inconsistencies persist. Reported prevalence rates vary widely across studies and regions, with some low-transmission areas documenting rates as low as 1.17%,[5] While others, such as Lake Tana and Mizan Tepi, report rates exceeding 20%.[6][7] These discrepancies are often inadequately explained, with limited consideration of seasonality, diagnostic methods (e.g., rapid diagnostic tests vs. microscopy), or sampling techniques factors that critically influence prevalence estimates and hinder cross-study comparability.
Furthermore, the literature reveals a disconnect in characterizing symptomatic versus asymptomatic infections. While baseline studies suggest that over 75% of positive cases are asymptomatic, subsequent research focuses on symptomatic populations, potentially underestimating the actual transmission burden.[8] This highlights the need for community-based surveillance, particularly in low-endemic and pre-elimination settings.
Age distribution patterns also challenge conventional intervention frameworks. Although most cases occur in individuals over five years of age, national and global strategies predominantly target children under five and pregnant women. This misalignment underscores the necessity for evidence-based adjustments in intervention targeting.
Spatial coverage in existing studies is uneven, with regions like Amhara receiving disproportionate attention, while high-risk areas like Gambella, Benishangul-Gumuz, and Somali remain underrepresented. This geographic bias may obscure critical transmission hotspots and impede equitable resource allocation.
Additionally, longitudinal analyses are scarce. For instance, fluctuations in malaria prevalence in Shewarobit town peaking in 2017 are reported without contextual explanation, limiting insights into the role of climatic shifts, intervention coverage, or behavioral changes over time.[9]
A 2021 systematic review estimated a pooled malaria prevalence of 13.6% among Ethiopian adults, with symptomatic and asymptomatic rates at 15.34% and 11.99%, respectively. Regional disparities were evident, with the highest prevalence in the Southern Nations, Nationalities, and Peoples’ Region (16.2%), followed by Oromia (13.11%) and Amhara (12.4%). Interestingly, Plasmodium falciparum and Plasmodium vivax contributed nearly equally to the disease burden 6.48% and 5.74%, respectively contradicting individual studies identifying P. falciparum as the dominant species.[10] These inconsistencies raise concerns about diagnostic accuracy, species misclassification, and the need for regionally nuanced analyses.
Historical data from the outskirts of Addis Ababa (1996–1999) suggest urban malaria outbreaks, yet contemporary research rarely links these findings to current urbanization trends, vector adaptation, or climate change. This oversight is particularly concerning given mounting evidence that malaria is increasingly affecting urban populations.[11]
In sum, while the literature on malaria in Ethiopia offers valuable descriptive insights, it is fragmented and constrained by methodological inconsistencies, spatial bias, and insufficient exploration of underlying drivers. This study addresses these gaps by examining malaria transmission’s socioeconomic, demographic, and ecological determinants in highland urban settings.
3. Methods
3.1 Study Design and Area
This cross-sectional study was conducted in Addis Ababa, the capital of Ethiopia, a highland urban area situated at an elevation of 2,355 meters above sea level (9°1′48″N, 38°44′24″E). Addis Ababa is Ethiopia’s political, economic, and cultural center and is administratively divided into 11 sub-cities. Despite its high-altitude location, malaria transmission has been consistently reported across several sub-cities, prompting the need for detailed epidemiological and ecological investigation.
The city’s topography, including its proximity to Mount Entoto and location within the Awash River watershed, contributes to unique microclimatic and ecological conditions that may influence vector breeding and malaria transmission dynamics. According to the Central Statistics Agency (CSA, July 2023),[12] Addis Ababa has an estimated population of 3.9 million, with women comprising 52.8%. The city’s demographic composition, rapid urbanization, and heterogeneous environmental settings highlight the importance of examining multifaceted determinants of malaria risk.
3.2 Study Population and Sampling Framework
The study employed a stratified approach to sample distinct populations across five randomly selected sub-cities of Addis Ababa. Facility-based surveys were conducted among outpatient department (OPD) visitors aged ≥15 years. These individuals were selected to examine health-seeking behaviors, exposure patterns, and socioeconomic correlates of malaria transmission. By selecting individuals already engaged with the healthcare system, this approach enabled the study to assess patient characteristics, health-seeking behaviors, and environmental exposures contributing to malaria transmission. The study used a two-stage random cluster sampling technique:
- Stage 1: Five sub-cities were randomly selected.
- Stage 2: Within each selected sub-city, 32 health facilities were proportionally sampled based on facility density.
A total of 670 participants were interviewed from health facilities; after data quality checks, 654 were included in the final analysis.
3.3 Sampling Technique and Sample Size
The sample size for assessing malaria’s socio-economic, environmental, and household determinants was determined using a statistical formula, incorporating key assumptions relevant to malaria prevalence in highland regions. Specifically, the calculation utilized:
- Malaria prevalence (p) of 23.3%, based on reported malaria prevalence at altitudes above 1,500 meters in the Kenyan highlands[13] used as a malaria prevalence (p),
- 95% confidence interval, ensuring statistical reliability and precision in estimating malaria burden
- Absolute error (d) of 0.05, defining the allowable margin of error for the prevalence estimate
This approach ensures that the sample size is statistically representative of the population affected by malaria within the study region, minimizing bias and enhancing the validity of findings.
Sample size = (z2*p(1-p))/d2
=1,962*0.233(0.767)/0.052
=274.6
=Multiplying by 2 for design effect: 550
= Adding a 15% non-response rate, the final sample size was 633. However, 670 participants were interviewed, and 654 with good data quality were included in the study. Please see Figure 1 for the selection of health facilities.
Figure 1: A diagram for the selection of health facilities for the interview of health facility visitors
3.4 Inclusion and Exclusion Criteria
Inclusion criteria: All patients above fifteen years, who visit the selected health facilities’ outpatient departments and/or malaria clinics.
Exclusion criteria: patients who are severely ill and children under fifteen were excluded from the study. Clients from outside of Addis Ababa city and referrals from other regions were excluded from the study.
Data collection: A semi-structured questionnaire was used to collect quantitative data on the environmental, sociodemographic, ecological, and household determinants of malaria incidence in the selected sub-cities.
2.5 Validity and Reliability Assurance
Validity Measures, such as using theory-based constructs, pilot testing of tools, triangulation of data sources and methods, and control of confounding through multivariate regression, are taken to ensure methodological rigor.
Reliability Measures such as consistent protocols across data collectors, training of enumerators and supervisors, use of Cronbach’s Alpha to assess internal consistency (Logistic regression model (socioeconomic/ecological factors and malaria): α = 0.65 (acceptable consistency).[14][15]
Multicollinearity Check: Variance Inflation Factor (VIF): All VIF values < 5 (Logistic regression model VIF = 1.24 (low collinearity).[16][17]
Model Diagnostics was evaluated using the Hosmer–Lemeshow test and classification metrics.
Confounding Control: Crude Odds Ratios (COR) and Adjusted Odds Ratios (AOR) were computed to isolate true associations between determinants and malaria risk.
4. Results
The analysis employs a structured approach to investigate malaria determinants, incorporating descriptive, bivariate, and multivariate logistic regression techniques. The descriptive analysis provides a foundational understanding of variable distributions, highlighting environmental, social, household, and ecological patterns. Bivariate analysis then examines individual associations between these independent variables and malaria infection, applying statistical tests such as the crude odds ratio. This step helps identify potential predictors before progressing to multivariate regression, ensuring that only relevant variables are retained for deeper examination.
Multivariate logistic regression evaluates the combined influence of multiple predictors on malaria infection, estimating adjusted odds ratios (AORs) while controlling for confounders. The logistic equation models the probability of infection, ensuring that variable interactions are accounted for. Diagnostic checks confirm the model’s validity, such as multicollinearity assessments (via VIF) and internal consistency (Cronbach’s alpha). This methodological framework strengthens the reliability of findings, offering valuable insights into the complex interplay of environmental and socioeconomic factors in malaria transmission.
Socio-demographic Characteristics
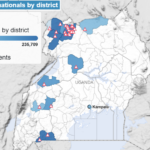
The majority (59.5%) of the participants were males. 26.3% of the participants were from the Lemikura sub-city, followed by 22.5% from Yeka. 61.6% of the participants were heads of their household, followed by 37.3% of the spouses who were heads of the household. Most participants (41.9%) were aged 35-44 years. 71.5% of participants were Orthodox Christians, followed by 14.8% Protestants in religion. 26.5% of the participants had a first degree or above. 75.2% of the participants were married, and most (60.9%) earn between 5000 and 15000 Ethiopian birr monthly. Regarding the participants’ occupations, most of them (49.1%) were government employees. 76.3% of the participants reported that one to three people live in the household. Please see Table 1 for detailed information on socio-demographic characteristics.
Table 1: Socio-demographic characteristics of research participants
| Characteristics | Category | Number | Percent (%) |
| Sub-city | Akaki Kality | 85 | 13.0 |
| Bole | 106 | 16.2 | |
| Lemikura | 172 | 26.3 | |
| Nifas Silk Lafto | 144 | 22.0 | |
| Yeka | 147 | 22.5 | |
| Sex | Male | 389 | 59.5 |
| Female | 265 | 40.5 | |
| Participant status in the household | Son or Daughter | 7 | 1.1 |
| Spouse of the head of household | 244 | 37.3 | |
| Head of household | 403 | 61.6 | |
| Age in Years | 15-25 years | 33 | 5.0 |
| 25-34 Years | 158 | 24.2 | |
| 35-44 years | 274 | 41.9 | |
| 45-60 Years | 182 | 27.8 | |
| Above 60 years | 7 | 1.1 | |
| Religion | Orthodox | 467 | 71.4 |
| Muslim | 86 | 13.1 | |
| Protestant | 97 | 14.8 | |
| Other | 4 | 0.6 | |
| Educational status | No formal education | 94 | 14.4 |
| Primary education | 205 | 31.3 | |
| Secondary high school | 162 | 24.8 | |
| First degree | 169 | 25.8 | |
| Masters and above | 24 | 3.7 | |
| Educational status of spouse | No formal education | 45 | 6.9 |
| Primary education | 146 | 22.3 | |
| Secondary high school | 160 | 24.5 | |
| First degree | 108 | 16.5 | |
| Masters and above | 18 | 2.8 | |
| NA | 177 | 27.1 | |
| Marital status | Single | 123 | 18.8 |
| Widowed | 16 | 2.4 | |
| Divorced | 23 | 3.5 | |
| Married | 492 | 75.2 | |
| Average income
in birr |
<5000 birr | 80 | 12.2 |
| 5001-15000 birr | 398 | 60.9 | |
| 15001-25000 birr | 127 | 19.4 | |
| 25001-35000 birr | 23 | 3.5 | |
| Above 35000 birr | 26 | 4.0 | |
| Occupation | Student | 14 | 2.1 |
| Daily laborer | 63 | 9.7 | |
| Private business | 224 | 34.3 | |
| Government employee | 321 | 49.1 | |
| NGO worker | 32 | 4.9 | |
| Number of people | 1 to 3 people | 499 | 76.3 |
| 4 to 5 people | 141 | 21.6 | |
| 6 to 7 People | 14 | 2.1 |
History of Participants’ Malaria Treatment, Ecological, Environmental, and Household Variables
Among 654 studied participants, 63(9.6%) reported being treated for malaria in the last five years. Males account for 78% of the infections, and 44% were in the 35 to 44 age group. About 51(81%) of the illnesses were due to the Plasmodium falciparum species. 244(37.3%) participants reported a travel history to a malaria-endemic area. Among them, 43(68.3%) of those who reported malaria infection history have a history of travel to a malaria-endemic area. Among the study participants, 361(55.2%) had no ITN in the household. Participants reported that the majority, 198(30.3%), of the houses they live in were constructed from mud and wood. Among participants who have latrines in the house, 352(70.7%) use flush toilets. Most participants, 630(96.3%), use piped water for drinking, and 618(94.2%) use electric stove cooking. 318 (54.3%) of participants live within one to two kilometers of a health facility. Agricultural practices are ongoing in around 240(36.7%) of the participants’ households; deforestation was conducted around the houses of 123(18.8%) participants in the last five years. Only 219 (33.5%) participants reported that malaria diagnosis is readily available in the area, while 248(37.9%) reported malaria treatment is available in their area or nearby health facilities. Please see Table 2 for more detailed information on the characteristics of environmental, ecological, and household variables.
Table 2: Characteristics of household and environmental variables
| Characteristics | Category | Number | Percent (%) |
| Number of ITNs in
the house |
None | 361 | 55.2 |
| One | 244 | 35.3 | |
| Two or more | 49 | 7.5 | |
| The wall is made of | Wood and mud | 198 | 30.3 |
| Cement | 240 | 36.7 | |
| Bricks | 216 | 33.0 | |
| Type of latrine
|
Pit latrine with slab | 114 | 22.9 |
| Ventilated improved pit latrine | 32 | 6.4 | |
| Flush toilet | 352 | 70.7 | |
| Source of drinking water | Water tanker | 24 | 3.7 |
| Pipe water | 630 | 96.3 | |
| Type of cooking fuel | Charcoal | 35 | 5.4 |
| Electric stove | 618 | 94.2 | |
| Gas stove | 3 | 0.5 | |
| Distance from HF (Km) | <0.2kms | 12 | 1.8 |
| 1-2 Kms | 365 | 54.3 | |
| 3-5 km | 287 | 43.8 | |
| Windows present
in the house |
Yes | 346 | 52.9 |
| No | 308 | 47.1 | |
| Electricity available | Yes | 409 | 62.5 |
| No | 245 | 37.5 | |
| The house is located
in a crowded area |
Yes | 317 | 48.5 |
| No | 337 | 51.5 | |
| Migrants enter the area or district | Yes
No |
161
493 |
24.6
75.4 |
| Malaria diagnosis is
readily available |
Yes | 219 | 33.5 |
| No | 435 | 66.5 | |
| Malaria treatment
easily available |
Yes | 248 | 37.9 |
| No | 406 | 62.1 | |
| Deforestation conducted
in the last 5 years |
Yes | 123 | 18.8 |
| No | 531 | 82.1 | |
| Agricultural practices
are ongoing in the area |
Yes | 240 | 36.7 |
| No | 414 | 63.3 |
Analysis of Study Participants’ Knowledge and Practice on Malaria
Participants’ knowledge of malaria prevention, signs, and symptoms was assessed using 24 key questions, while practice was evaluated through 10 targeted items. Respondents who answered 50% or more of the questions correctly were categorized as having good knowledge or practice. Accordingly, 414 participants (63.3%) demonstrated poor knowledge, and 531 participants (81.2%) exhibited poor preventive practice against malaria.
The respondents’ specific knowledge regarding malaria transmission, prevention, and treatment is presented in Table 3. A significant portion of individuals hold misconceptions about malaria transmission, with over 60% incorrectly believing that malaria can spread through breathing, and nearly 25% thinking it is transmitted via person-to-person contact or patient interaction. However, 75.7% correctly identify mosquito bites as the primary transmission mode, showing a strong understanding. Knowledge gaps persist, as 9.8% explicitly reported not knowing the transmission routes, and there is uncertainty about whether malaria spreads more during the day or evening.
Regarding malaria prevention and treatment, over 81% recognize malaria as curable, and 86.5% acknowledge its preventability, indicating a strong awareness of control measures. However, perceptions of effective prevention strategies vary, with only 19.6% believing that staying indoors at night reduces risk, and 18.3% recognizing mosquito nets as protective, which suggests the need for targeted health education. Chemical interventions such as spraying with DDT (44%) and aerosols (33.3%) are perceived as moderately effective, while draining mosquito breeding sites (1.5%) and screening windows (4.4%) are poorly recognized as preventive measures. Table 3 presents the detailed frequencies of the knowledge of participants. Please see Table 3, which presents the detailed frequencies of participants’ knowledge.
Table 3: Knowledge of participants on malaria signs, symptoms, and prevention
| Characteristics | Yes (Number(%)) | No (Number(%)) | ||
| Malaria is transmitted from person to person | 163(24.9) | 423(64.7) | ||
| Malaria is transmitted by breathing | 400(61.2) | 254(38.8) | ||
| Mosquito bites transmit malaria | 495(75.7) | 159(24.3) | ||
| Malaria is transmitted by patient contact | 132(20.2) | 522(79.8) | ||
| Malaria is transmitted through drinking dirty water. | 82(12.5) | 572(87.5) | ||
| Malaria is transmitted through exposure to a swampy area. |
34(5.2) |
620(94.8) |
||
| Do not know | 64(9.8) | ….. | ||
| Malaria is transmitted during the day | 320(48.9) | 334(51.1) | ||
| Malaria is transmitted during the evening | 318(48.6) | 336(51.4) | ||
| Malaria is transmitted during the day and night | 110(16.8) | 544(83.2) | ||
| Do not know | 33(5.0) | …… | ||
| Knows the signs and symptoms of malaria | 282(43.1) | 372(56.9) | ||
| Malaria is curable | 535(81.8) | 119(18.2) | ||
| Malaria is preventable | 566(86.5) | 88(13.5) | ||
| Eating good food can prevent malaria | 350(53.5) | 304(46.5) | ||
| Cleaning the house can prevent malaria | 347(53.1) | 307(46.9) | ||
| Remaining indoors at night can prevent malaria | 128(19.6) | 526(80.4) | ||
| Sleeping under mosquito nets prevents malaria | 120(18.3) | 534(81.7) | ||
| Spraying a house with DDT can prevent malaria | 288(44.0) | 366(56.0) | ||
| Spraying aerosols can prevent malaria | 218(33.3) | 436(66.7) | ||
| Fumigation or smoking can prevent malaria | 33(5.0) | 621(95.0) | ||
| Applying ointment or repellents can prevent malaria | 42(6.4) | 612(93.6) | ||
| Draining mosquito breeding sites can prevent malaria. | 10(1.5) | 644(98.5) | ||
| Screening windows can prevent malaria | 29(4.4) | 625(95.6) | ||
| Do not know | 22(3.4%) | ….. | ||
| Heard about mosquito nets before | 125(19.1) | 529(80.9) | ||
| Believes using ITN at night prevents malaria | 148(22.6 | 506(77.4) | ||
| Believes using ITN prevents bites from other insects |
154(23.5) |
500(76.5) |
||
The data in Table 4, practice on malaria prevention, reveals low adoption of key malaria prevention measures, with only 30% having used insecticide-treated nets (ITNs) in the last week, and just 15.4% reporting household spraying with DDT in the past six months. Nighttime protection through insect repellents remains underutilized (24.6%), highlighting potential gaps in preventive behaviors. Despite this, health-seeking behavior is moderately intense, as 55.5% seek healthcare within 48 hours of illness, and 61% receive regular health education, suggesting that awareness initiatives are reaching most of the population.
Table 4: Practice of study participants on malaria prevention
| Characteristics | Yes (Number(%)) | No (Number(%)) |
| Used ITN in the last week | 196(30.0) | 458(70.0) |
| House was sprayed with DDT in the last 6 months | 101(15.4) | 553(84.6) |
| Uses insect repellants at night | 161(24.6) | 493(75.4) |
| Visit HF in 48 hours when getting sick | 363(55.5) | 291(44.5) |
| Receive regular health education | 399(61.0) | 255(39.0) |
| The community conducts regular drainage of swamps. |
132(20.2) |
522(79.8) |
| The community conducts regular environmental cleanups. |
185(28.3) |
469(71.7) |
| Liquid waste is present outside the house | 296(45.3) | 358(54.7) |
| Functional toilet available | 498(76.1) | 156(23.9) |
At the community level, drainage of swamps (20.2%) and environmental cleanups (28.3%) are not consistently practiced, which may contribute to vector breeding. Nearly half (45.3%) households report liquid waste outside their homes, further underscoring sanitation challenges. However, 76.1% have access to a functional toilet, which indicates relatively strong household infrastructure. The findings emphasize the need for enhanced mosquito control interventions, stronger ITN utilization campaigns, and improved environmental sanitation to mitigate malaria risk effectively.
A logistic regression model was applied to assess the association between malaria infection and associated socioeconomic, household, and environmental factors. Variance Inflation Factor (VIF) analysis was conducted to evaluate multicollinearity and ensure model stability. The mean VIF for the model is 1.24, indicating acceptable levels of collinearity. Table 5 presents the VIF scores for the fitted variables.
Table 5: Variance Inflation Factor analysis for malaria prevalence determinant variables
| Variable | VIF | SQRT VIF | Tolerance | R-Squared |
| Sex | 1.09 | 1.04 | 0.9201 | 0.0799 |
| Educational status | 1.03 | 1.02 | 0.9698 | 0.0302 |
| Number of people in the house | 1.07 | 1.04 | 0.9332 | 0.0668 |
| Travel to an endemic area | 1.18 | 1.09 | 0.849 | 0.151 |
| House was sprayed with IRS in the last 6 months | 1.31 | 1.14 | 0.7648 | 0.2352 |
| Uses insecticide repellants at night | 1.46 | 1.21 | 0.6862 | 0.3138 |
| Wall_materials | 1.11 | 1.06 | 0.8977 | 0.1023 |
| windows_presence | 1.43 | 1.2 | 0.6984 | 0.3016 |
| liquid_waste_outsidehouse | 1.39 | 1.18 | 0.7212 | 0.2788 |
| House is located in a crowded area | 1.27 | 1.13 | 0.7888 | 0.2112 |
| Agricultural practices are ongoing in the area | 1.27 | 1.13 | 0.7874 | 0.2126 |
| Deforestation in the last 5 years | 1.26 | 1.12 | 0.7966 | 0.2034 |
| Migrants come to the area of residence | 1.31 | 1.15 | 0.7609 | 0.2391 |
| Mean VIF | 1.24 |
As shown in the table above, all variables have a VIF below three, confirming that multicollinearity does not significantly affect the model.
The association analysis of environmental, social, and ecological variables with malaria prevalence indicates that sex shows a significant association, with females having a lower likelihood of malaria prevalence than males (AOR: 0.38, 95% CI: 0.18–0.81, p=0.011). Regarding educational status, individuals with a first degree also show a significant association for a lower likelihood of malaria prevalence (AOR: 0.38, 95% CI: 0.15–0.98, p=0.045), while other levels of education, such as primary and secondary, do not yield statistically significant results.
The number of people in the households did not show any significant association with a result of four to five members (AOR: 0.57, 95% CI: 0.22–1.46, p=0.243), six to seven members (AOR: 3.57, 95% CI: 0.34–37.57, p=0.289).
History of travel to endemic areas demonstrates a highly significant association with malaria prevalence (AOR: 7.77, 95% CI: 3.83–15.77, p<0.001). ITN and the number of insecticide-treated nets (ITNs) in the house do not show a statistically significant relationship across categories. House spraying in the last six months and use of insect repellents also fail to show significant associations (AOR: 1.45, p=0.428; AOR: 0.58, p=0.227, respectively).
Structural characteristics, such as the material of walls and the presence of windows, do not yield statistically significant results. While cement walls show higher crude odds (COR: 3.23), their adjusted odds (AOR: 2.21, p=0.118) were insignificant for malaria outcome. The presence of windows nearly reaches significance with an AOR of 2.28 (95% CI: 0.97–5.34, p=0.058) but fails to show a significant association with malaria prevalence.
For more detailed information on the association of environmental, socioeconomic, and ecological variables with crude odds ratios and adjusted odds ratios, please see Table 6 below.
Table 6: Association of malaria with environmental, social, and ecological variables
| Category | Characteristics | COR (95%CI) | AOR (95%CI) | P-value |
| Sex | Female | 0.39(0.21, 0.72) | 0.38(0.18, 0.81) | 0.011* |
| Male | 1.00 | |||
| Educational status | Primary edu. | 0.27(0.12, 0.63 ) | 0.36(0.13, 1.00) | 0.051 |
| Secondary edu. | 0.70(0.34, 1.45) | 0.61(0.25, 1.49) | 0.279 | |
| First degree | 0.51(0.24, 1.10) | 0.38(0.15,0.98) | 0.045* | |
| Master and above | 1.05(0.32, 3.52) | 0.56(0.12, 2.52) | ||
| No education | 1.00 | |||
| Number of People in the house | 4 to 5 | 0.42(0.19, 0.95) | 0.57(0.22, 1.46) | 0.243 |
| 6 to 7 | 0.62(0.08, 4.84) | 3.57(0.34, 37.57) | 0.289 | |
| 1 to 3 | 1.00 | |||
| Travel to an endemic area | Yes | 4.17(2.39,7.28) | 7.77(3.83, 15.77) | <0.001** |
| No | 1.00 | |||
| Number of ITNs in the house | One | 0.53(0.29, 0.97) | 0.88(0.37, 2.08) | 0.764 |
| Two | 1.15(0.43, 3.11) | 2.13(0.55, 8.20) | 0.273 | |
| More than two | 0.000 | 0.000 | 0.999 | |
| None | 1.00 | |||
| The house was sprayed in the last 6 months | Yes | 2.45(1.35, 4.43) | 1.45(0.58, 6.63) | 0.428 |
| No | 1.00 | |||
| Use insect repellents | Yes | 1.61(0.92, 2.81) | 0.58(0.24, 1.40) | 0.227 |
| No | 1.00 | |||
| The house wall is made of | Cement | 3.23(1.50, 6.95) | 2.21(0.82, 5.98) | 0.118 |
| Bricks | 2.42(1.09, 5.39) | 1.05(0.39, 2.86) | 0.921 | |
| Wood and mud | 1.00 | |||
| Windows present in the house | Yes | 5.39(2.69,10.80) | 2.28(0.97, 5.34) | 0.058 |
| No | 1.00 | |||
| Liquid waste is present outside the house | Yes | 3.12(1.78, 5.47) | 1.89(0.93, 3.88) | 0.080 |
| No | 1.00 | |||
| Receives regular health education | Yes | 4.94(2.31, 10.55) | 2.19(0.87, 5.51) | 0.097 |
| No | 1.00 | |||
| The house is located in a crowded area | Yes | 2.93(1.66, 5.18) | 1.19(0.57, 2.490 | 0.644 |
| No | 1.00 | |||
| Migrants enter the area | Yes | 0.55(0.27, 1.12) | 0.39(0.14, 1.07) | 0.068 |
| No | 1.00 | |||
| Agriculture is ongoing in the area | Yes | 3.97(2.29, 6.89) | 2.16(1.07, 4.36) | 0.033* |
| No | 1.00 | |||
| Deforestation in the last 5 years | Yes | 2.20(1.24, 3.90) | 2.01(0.91, 4.45) | 0.085 |
| No | 1.00 |
*p<0.05, ** p<0.01, ***p<0.001
To ensure the robustness of the findings, multivariate analysis was conducted to control for potential confounding variables that could distort the observed associations. The initial bivariate analysis identified more than ten variables that showed statistical associations with the dependent variable. However, only four variables remained statistically significant when adjusted for confounders in the multivariate model, demonstrating a stronger independent effect on the outcome.
This approach allows for a more precise estimation of each variable’s influence while mitigating biases introduced by overlapping effects among predictors. By including multiple covariates in the regression model, the analysis accounts for interdependencies, ensuring that only variables with genuine, independent associations are retained in the final results.
5. Discussion
The malaria prevalence estimate of 9.6% (96 per 1000 population) among study participants was notably higher than the 7.4 per 1000 reported in administrative data. This gap underscores the limitations of administrative health records, which often suffer from incompleteness due to reporting inconsistencies and underrepresent those seeking care in unregistered private facilities. Consequently, malaria prevalence may be underestimated, leading to an insufficient response from health authorities. This finding highlights the need for enhanced surveillance systems integrating community-based data collection to capture hidden malaria cases.
The high prevalence of Plasmodium falciparum (81% of cases) highlights its dominance as the primary agent in malaria transmission within the Epidemiologic Triad Model. Its high virulence, rapid replication, and resistance concerns make it the most severe malaria-causing parasite. The host factor, including susceptibility among different groups and immunocompromised individuals, significantly influences disease severity. Moreover, human behavior, such as delayed healthcare-seeking and inconsistent use of insecticide-treated nets, exacerbates transmission risks. The environment, characterized by increasing minimum temperature and seasonal variations, creates optimal conditions for Anopheles mosquitoes, which serve as vectors for P. falciparum transmission. Limited diagnostic resources, treatment access barriers, and inconsistent surveillance further sustain transmission cycles, underscoring the need for integrated vector control, improved healthcare access, and strengthened surveillance systems to mitigate the burden of falciparum malaria species.
Mobility as a Primary Driver of Highland Malaria
Although this cross-sectional study is constrained by limitations to establish temporal causality, its findings underscore a compelling association between travel and malaria incidence in highland regions. Notably, 68.3% of reported malaria cases were linked to travel to endemic areas, suggesting that transmission in these zones is predominantly imported rather than locally sustained. This challenges the prevailing assumption that environmental factors alone primarily influence high-altitude malaria cases. Instead, human mobility emerges as a critical determinant, reinforcing findings from other studies in Ethiopia, Zambia, and the Gardula highland zone.[18][19] The significant adjusted odds ratio (AOR: 7.77, p<0.001) reflects how travel-related malaria introduces new transmission risks, requiring targeted intervention strategies such as screening travelers from endemic regions and strengthening surveillance at migration hotspots.
Knowledge and Behavioral Gaps in Malaria Prevention
The study revealed striking knowledge deficits (63.3%) and poor malaria prevention practices (81.2%) among participants. While low awareness of malaria symptoms and transmission routes is a well-documented barrier to disease control, the particularly high percentage of individuals failing to adopt preventive measures suggests deeper behavioral challenges beyond simple awareness. Despite global malaria education campaigns, the data indicate that information alone does not always translate into action. Social and economic factors such as cost barriers to insecticide-treated nets (ITNs), perception of risk, and entrenched local beliefs may hinder adoption of preventive behaviors, calling for more tailored health promotion efforts that address these psychological and structural obstacles.
Findings suggest that females have 62% lower odds of experiencing malaria than males (AOR: 0.38, p=0.011). While existing literature attributes this disparity to biological and hormonal factors (such as estrogen’s potential protective role), behavioral aspects likely play an equally important role. The tendency for males to engage more in outdoor occupational activities, exposing them to mosquito bites, could explain part of this difference. However, contrasting findings from studies in Uganda and Peshawar, which reported higher malaria prevalence among females, highlight the context-specific nature of sex-related malaria risk.[20][21][22] The variation across studies suggests socioeconomic, cultural, and environmental factors should be further explored rather than attributing the difference solely to biological immunity.
Individuals with a first-degree education status were significantly less likely to develop malaria (AOR: 0.38, p=0.045) than those without formal education. This association reinforces established research linking higher education levels to increased malaria awareness and adherence to prevention strategies such as using ITNs, wearing protective clothing, and eliminating breeding grounds.[23] Moreover, education often correlates with higher socioeconomic status, enabling access to better housing conditions, such as window screens and secure sleeping environments, reducing mosquito exposure.[24][25] However, disparities in malaria knowledge among educated individuals indicate that formal education alone does not always ensure effective prevention. This suggests the need for continuous public health education across all demographic groups.
The study found a significant association between agricultural activities and malaria prevalence (AOR: 2.16, p=0.036), aligning with findings from studies in the Democratic Republic of Congo (DRC),[26] Côte d’Ivoire,[27] And Ethiopia’s Sidama region.[28] Agriculture creates favorable conditions for mosquito breeding, especially in irrigated farmland, stagnant water pools, and livestock shelters that attract vectors. Seasonal labor migration in agricultural zones could further drive malaria transmission. This suggests that interventions should focus on vector control strategies tailored to agrarian settings, such as integrated pest management and drainage system improvements.
Unlike other studies that identified a strong correlation between malaria prevalence and commonly studied environmental, household, and ecological factors, such as insecticide-treated net (ITN) use, the number of ITNs per household, use of insect repellents, migration patterns, and deforestation, this study found no significant association between these variables and malaria burden. This unexplained result may be due to the specific characteristics of the study area and additional factors. These may include the fact that malaria cases in the study area are primarily imported rather than locally transmitted, and factors such as ITN use and insect repellent application were not enforced and may not show strong associations. High mobility of migrants could influence malaria transmission dynamics, making it difficult to establish direct links with household or environmental factors.
Although travel was the most critical risk factor for imported cases, urban environmental degradation will likely amplify malaria transmission further. Observational findings also indicated poor drainage infrastructure, patches of slum areas with un-sanitized setups, and construction sites with stagnant water, all of which are consistent with other studies that show amplified urban malaria vulnerability. For example, piles of trash and water accumulating at the bases of buildings could provide niche habitats for vectors, which may be forcing reconsideration of the assumption that highland cities are safer from these vectors due to their height above sea level. The findings have implications for increasing synergies between municipal infrastructure development plans and malaria vector control programs.
Limitations: As a cross-sectional study, this research faces inherent challenges in establishing causal relationships and temporal order. Specifically, determining whether malaria preceded travel history or vice versa remains uncertain, as both variables were measured simultaneously. This limitation highlights the need for longitudinal studies or cohort-based tracking to strengthen causal inferences regarding malaria transmission dynamics.
6. Conclusion
The study highlighted that social determinants such as travel history to endemic areas, low malaria-related knowledge, and poor prevention practices may contribute to sustained transmission risks in Addis Ababa. These findings indicate behavioral and awareness gaps that could hinder malaria control efforts, emphasizing the need for targeted public health interventions.
The country and IGOs need to deploy indoor residual spraying (IRS) in identified hotspots to prevent mosquito transmission, especially from imported malaria, scale up distribution and correct usage of insecticide-treated nets (ITNs), establish traveler screening protocols to limit the importation of malaria cases, promote mosquito-proof housing designs, especially in vulnerable low-altitude sub-cities, expand urban planning policies that incorporate malaria risk reduction into environmental management, establish cross-sector working groups to mainstream malaria control into broader development frameworks, secure sustained government funding and regulatory oversight to meet WHO health system readiness standards. They should launch mass education campaigns to improve knowledge of malaria symptoms, transmission, and preventive measures, strengthen behavioral change communication strategies to ensure knowledge translates into action, and integrate malaria education into school curricula and workplace health programs for sustained community engagement.
7. Acknowledgement
The author acknowledges the support of Dr. Zerai Hagos for his invaluable guidance and comprehensive review during the preparation of the dissertation process from which this article was published.
- Conflict of Interest
The author declares that there is no conflict of interest.
9. References
Addis Ababa Health Bureau. “Addis Ababa Health Bureau Annual Epidemiologic Bulletin.” Addis Ababa: AA Health Bureau, 2024.
Adugna, Fasil, Melaku Wale, and Endalkachew Nibret. “Prevalence of Malaria and Its Risk Factors in Lake Tana and Surrounding Areas, Northwest Ethiopia.” Malaria Journal 21, no. 1 (2022): 313. https://doi.org/10.1186/s12936-022-04310-7.
Ahmad, Nurhafizah, Fadzilawani Astifar Alias, Muniroh Hamat, and Siti Asmah Mohamed. RELIABILITY ANALYSIS: APPLICATION OF CRONBACH’S ALPHA IN RESEARCH INSTRUMENTS. 2024.
Anjorin, Seun, Elvis Okolie, and Sanni Yaya. “Malaria Profile and Socioeconomic Predictors among Under-Five Children: An Analysis of 11 Sub-Saharan African Countries.” Malaria Journal 22, no. 1 (2023): 55. https://doi.org/10.1186/s12936-023-04484-8.
Assefa, Muluken, Fekadu Massebo, Temesgen Ashine, and Teklu Wegayehu. “Population Travel Increases the Risk of Plasmodium Falciparum Infection in the Highland Population of Gardula Zone, South Ethiopia: A Longitudinal Study.” PLOS ONE 19, no. 12 (2024): e0315900. https://doi.org/10.1371/journal.pone.0315900.
Baliraine, Frederick N., Yaw A. Afrane, Dolphine A. Amenya, et al. “High Prevalence of Asymptomatic Plasmodium Falciparum Infections in a Highland Area of Western Kenya: A Cohort Study.” The Journal of Infectious Diseases 200, no. 1 (2009): 66–74. https://doi.org/10.1086/599317.
Beke, Obo Armel-Hermann, Serge-Brice Assi, Akedjro Paul Harvey Kokrasset, et al. “Implication of Agricultural Practices in the Micro-Geographic Heterogeneity of Malaria Transmission in Bouna, Côte d’Ivoire.” Malaria Journal 22, no. 1 (2023): 313. https://doi.org/10.1186/s12936-023-04748-3.
CSA-Ethiopia. “Population of Zones and Weredas Projected as of July 2023.” Addis Ababa: CSA, 2023.
Duguma, Tadesse, Eyob Tekalign, Dassalegn Muleta, and Asnake Simieneh. “Malaria Prevalence and Risk Factors among Patients Visiting Mizan Tepi University Teaching Hospital, Southwest Ethiopia.” PLOS ONE 17, no. 7 (2022): e0271771. https://doi.org/10.1371/journal.pone.0271771.
Hawaria, Dawit, and Solomon Kibret. “Increased Malaria Incidence Following Irrigation Practices in the Endorheic Rift Valley Basin of Sidama Region, Ethiopia.” PLOS ONE 18, no. 4 (2023): e0284247. https://doi.org/10.1371/journal.pone.0284247.
Ipa, Mara, Agung Dwi Laksono, Endang Puji Astuti, Heni Prasetyowati, and Lukman Hakim. “Predictors of Malaria Incidence in Rural Eastern Indonesia.” Indian Journal of Forensic Medicine and Toxicology 14, no. 4 (2020). https://doi.org/10.37506/ijfmt.v14i4.12078.
Janko, Mark M, Seth R Irish, Brian J Reich, et al. “The Links between Agriculture, Anopheles Mosquitoes, and Malaria Risk in Children Younger than 5 Years in the Democratic Republic of the Congo: A Population-Based, Cross-Sectional, Spatial Study.” The Lancet Planetary Health 2, no. 2 (2018): e74–82. https://doi.org/10.1016/S2542-5196(18)30009-3.
Kendie, Fasil Adugna, Tamirat Hailegebriel W/kiros, Endalkachew Nibret Semegn, and Melaku Wale Ferede. “Prevalence of Malaria among Adults in Ethiopia: A Systematic Review and Meta-Analysis.” Journal of Tropical Medicine 2021 (March 2021): 1–9. https://doi.org/10.1155/2021/8863002.
Khazaee-Pool, Maryam, Mahmood Moosazadeh, Mehran Asadi-Aliabadi, Fereshteh Yazdani, and Koen Ponnet. “Gender Characteristics, Social Determinants, and Seasonal Patterns of Malaria Incidence, Relapse, and Mortality in Sistan and Baluchistan Province and Other Provinces of Iran: A Systematic Review and Meta-Analysis.” BMC Infectious Diseases 25, no. 1 (2025): 154. https://doi.org/10.1186/s12879-025-10542-0.
Ministry of Health- Ethiopia. “ETHIOPIA MALARIA ELIMINATION STRATEGIC PLAN: 2021-2025.” Addis Ababa: MOH, 2020.
Nega, Desalegn, Adugna Abera, Bokretsion Gidey, et al. “Baseline Malaria Prevalence at the Targeted Pre-Elimination Districts in Ethiopia.” BMC Public Health 21, no. 1 (2021): 1996. https://doi.org/10.1186/s12889-021-12036-5.
Okiring, Jaffer, Adrienne Epstein, Jane F. Namuganga, et al. “Gender Difference in the Incidence of Malaria Diagnosed at Public Health Facilities in Uganda.” Malaria Journal 21, no. 1 (2022): 22. https://doi.org/10.1186/s12936-022-04046-4.
Okumu, Fredros, Margaret Gyapong, Núria Casamitjana, et al. “What Africa Can Do to Accelerate and Sustain Progress against Malaria.” PLOS Global Public Health 2, no. 6 (2022): e0000262. https://doi.org/10.1371/journal.pgph.0000262.
Pallant, Julie. SPSS Survival Manual: A Step-by-Step Guide to Data Analysis Using IBM SPSS. Sixth. Open University Press McGraw-Hill Education McGraw-Hill House, 2016.
Porter, Travis R., Timothy P. Finn, Kafula Silumbe, et al. “Recent Travel History and Plasmodium Falciparum Malaria Infection in a Region of Heterogeneous Transmission in Southern Province, Zambia.” The American Journal of Tropical Medicine and Hygiene 103, no. 2_Suppl (2020): 74–81. https://doi.org/10.4269/ajtmh.19-0660.
Raasti, Aamna, Omazia Nasir, Muhammad Arslan Khalid, Shifa Zafar, Wali Khan, and Syeda Fatima Nadeem. “Evaluating Malaria Prevalence Across Different Age and Gender Groups in Peshawar Through Light Microscopic Analysis.” Journal of Health and Rehabilitation Research 4, no. 2 (2024): 767–71. https://doi.org/10.61919/jhrr.v4i2.952.
Research-Methodology. “Research Reliability.” Accessed September 24, 2024. https://research-methodology.net/research-methodology/reliability-validity-and-repeatability/research-reliability/.
Siri, José G. “Independent Associations of Maternal Education and Household Wealth with Malaria Risk in Children.” Ecology and Society 19, no. 1 (2014): art33. https://doi.org/10.5751/ES-06134-190133.
stataiml. “Thresholds for Detecting Multicollinearity.” Stataiml, July 2, 2024. https://stataiml.com/posts/60_multicollinearity_threshold_ml/.
Teshome Shiferawu, Tadegew, and Azene Tesfaye Desta. “Five-Year Trend Analysis of Malaria Prevalence in Shewarobit, Amhara Regional State, North-Central Ethiopia.” Pan African Medical Journal 40 (2021). https://doi.org/10.11604/pamj.2021.40.237.30614.
Tusting, Lucy S., Christian Bottomley, Harry Gibson, et al. “Housing Improvements and Malaria Risk in Sub-Saharan Africa: A Multi-Country Analysis of Survey Data.” PLOS Medicine 14, no. 2 (2017): e1002234. https://doi.org/10.1371/journal.pmed.1002234.
Weyessa, Adugna, Teshome Gcbre-MichaeI, Ahmed ALI, and Daniel Kebede. “Malaria in Addis Ababa and Its Environs: Assessment of Magnitude and Distribution.” Ethiop. J.Health Dev. 16, no. 2 (2002): 147–55.
Workineh, Lemma, Misganew Lakew, Shega Dires, et al. “Prevalence of Malaria and Associated Factors Among Children Attending Health Institutions at South Gondar Zone, Northwest Ethiopia: A Cross-Sectional Study.” Global Pediatric Health 8 (January 2021): 2333794X2110591. https://doi.org/10.1177/2333794X211059107.
[1] Ministry of Health- Ethiopia, “ETHIOPIA MALARIA ELIMINATION STRATEGIC PLAN: 2021-2025,” Addis Ababa: MOH, 2020.
[2] Fredros Okumu et al., “What Africa Can Do to Accelerate and Sustain Progress against Malaria,” PLOS Global Public Health 2, no. 6 (2022): 12, https://doi.org/10.1371/journal.pgph.0000262.
[3] Addis Ababa Health Bureau, “Addis Ababa Health Bureau Annual Epidemiologic Bulletin,” Addis Ababa: AA Health Bureau, 2024, 10–15.
[4] Lucy S. Tusting et al., “Housing Improvements and Malaria Risk in Sub-Saharan Africa: A Multi-Country Analysis of Survey Data,” PLOS Medicine 14, no. 2 (2017): e1002234, https://doi.org/10.1371/journal.pmed.1002234.
[5] Desalegn Nega et al., “Baseline Malaria Prevalence at the Targeted Pre-Elimination Districts in Ethiopia,” BMC Public Health 21, no. 1 (2021): 6–7, https://doi.org/10.1186/s12889-021-12036-5.
[6] Fasil Adugna et al., “Prevalence of Malaria and Its Risk Factors in Lake Tana and Surrounding Areas, Northwest Ethiopia,” Malaria Journal 21, no. 1 (2022): 5, https://doi.org/10.1186/s12936-022-04310-7.
[7] Tadesse Duguma et al., “Malaria Prevalence and Risk Factors among Patients Visiting Mizan Tepi University Teaching Hospital, Southwest Ethiopia,” PLOS ONE 17, no. 7 (2022): 7, https://doi.org/10.1371/journal.pone.0271771.
[8] Lemma Workineh et al., “Prevalence of Malaria and Associated Factors Among Children Attending Health Institutions at South Gondar Zone, Northwest Ethiopia: A Cross-Sectional Study,” Global Pediatric Health 8 (January 2021): 7, https://doi.org/10.1177/2333794X211059107.
[9] Tadegew Teshome Shiferawu and Azene Tesfaye Desta, “Five-Year Trend Analysis of Malaria Prevalence in Shewarobit, Amhara Regional State, North-Central Ethiopia,” Pan African Medical Journal 40 (2021): 6, https://doi.org/10.11604/pamj.2021.40.237.30614.
[10] Fasil Adugna Kendie et al., “Prevalence of Malaria among Adults in Ethiopia: A Systematic Review and Meta-Analysis,” Journal of Tropical Medicine 2021 (March 2021): 6–7, https://doi.org/10.1155/2021/8863002.
[11] Adugna Weyessa et al., “Malaria in Addis Ababa and Its Environs: Assessment of Magnitude and Distribution,” Ethiop.J.Health Dev. 16, no. 2 (2002): 147.
[12] CSA-Ethiopia, “Population of Zones and Weredas Projected as of July 2023,” 31.
[13] Frederick N. Baliraine et al., “High Prevalence of Asymptomatic Plasmodium Falciparum Infections in a Highland Area of Western Kenya: A Cohort Study,” The Journal of Infectious Diseases 200, no. 1 (2009): 15, https://doi.org/10.1086/599317.
[14] “Research Reliability,” Research-Methodology, accessed September 24, 2024, https://research-methodology.net/research-methodology/reliability-validity-and-repeatability/research-reliability/.
[15] Nurhafizah Ahmad et al., RELIABILITY ANALYSIS: APPLICATION OF CRONBACH’S ALPHA IN RESEARCH INSTRUMENTS, 2024, 116.
[16] Julie Pallant, SPSS Survival Manual: A Step-by-Step Guide to Data Analysis Using IBM SPSS, Sixth (Open University Press McGraw-Hill Education McGraw-Hill House, 2016), 3.
[17] stataiml, “Thresholds for Detecting Multicollinearity,” Stataiml, July 2, 2024, https://stataiml.com/posts/60_multicollinearity_threshold_ml/.
[18] Muluken Assefa et al., “Population Travel Increases the Risk of Plasmodium Falciparum Infection in the Highland Population of Gardula Zone, South Ethiopia: A Longitudinal Study,” PLOS ONE 19, no. 12 (2024): 12, https://doi.org/10.1371/journal.pone.0315900.
[19] Travis R. Porter et al., “Recent Travel History and Plasmodium Falciparum Malaria Infection in a Region of Heterogenous Transmission in Southern Province, Zambia,” The American Journal of Tropical Medicine and Hygiene 103, no. 2_Suppl (2020): 79–80, https://doi.org/10.4269/ajtmh.19-0660.
[20] Maryam Khazaee-Pool et al., “Gender Characteristics, Social Determinants, and Seasonal Patterns of Malaria Incidence, Relapse, and Mortality in Sistan and Baluchistan Province and Other Province of Iran: A Systematic Review and Meta-Analysis,” BMC Infectious Diseases 25, no. 1 (2025): 25, https://doi.org/10.1186/s12879-025-10542-0.
[21] Aamna Raasti et al., “Evaluating Malaria Prevalence Across Different Age and Gender Groups in Peshawar Through Light Microscopic Analysis,” Journal of Health and Rehabilitation Research 4, no. 2 (2024): 771, https://doi.org/10.61919/jhrr.v4i2.952.
[22] Jaffer Okiring et al., “Gender Difference in the Incidence of Malaria Diagnosed at Public Health Facilities in Uganda,” Malaria Journal 21, no. 1 (2022): 13, https://doi.org/10.1186/s12936-022-04046-4.
[23] José G. Siri, “Independent Associations of Maternal Education and Household Wealth with Malaria Risk in Children,” Ecology and Society 19, no. 1 (2014): art33, https://doi.org/10.5751/ES-06134-190133.
[24] Mara Ipa et al., “Predictors of Malaria Incidence in Rural Eastern Indonesia,” Indian Journal of Forensic Medicine and Toxicology 14, no. 4 (2020): 3110, https://doi.org/10.37506/ijfmt.v14i4.12078.
[25] Seun Anjorin et al., “Malaria Profile and Socioeconomic Predictors among Under-Five Children: An Analysis of 11 Sub-Saharan African Countries,” Malaria Journal 22, no. 1 (2023): 10, https://doi.org/10.1186/s12936-023-04484-8.
[26] Mark M Janko et al., “The Links between Agriculture, Anopheles Mosquitoes, and Malaria Risk in Children Younger than 5 Years in the Democratic Republic of the Congo: A Population-Based, Cross-Sectional, Spatial Study,” The Lancet Planetary Health 2, no. 2 (2018): 81, https://doi.org/10.1016/S2542-5196(18)30009-3.
[27] Obo Armel-Hermann Beke et al., “Implication of Agricultural Practices in the Micro-Geographic Heterogeneity of Malaria Transmission in Bouna, Côte d’Ivoire,” Malaria Journal 22, no. 1 (2023): 15, https://doi.org/10.1186/s12936-023-04748-3.
[28] Dawit Hawaria and Solomon Kibret, “Increased Malaria Incidence Following Irrigation Practices in the Endorheic Rift Valley Basin of Sidama Region, Ethiopia,” PLOS ONE 18, no. 4 (2023): 10, https://doi.org/10.1371/journal.pone.0284247.