
ABSTRACT
| Hypertension (HTN) and diabetes (DM) are major contributors to morbidity and premature mortality in Ghana, with national prevalence estimates of about 27% and 6–9%, respectively. However, limited evidence exists on their burden in remote rural populations due to poor access to screening, diagnosis, and continuous care.
This population-based cross-sectional study involved 507 adults aged 18–75 years in remote communities of the Akatsi South District, Volta Region, Ghana. Blood pressure was measured using a calibrated Omron M3 digital sphygmomanometer, while fasting blood glucose was assessed via finger-prick testing using an AccuChek Instant device. Anthropometric measurements were used to calculate body mass index (BMI). Data were analyzed using Epi Info (descriptive statistics) and SPSS (bivariate and multivariable analyses). The prevalence of hypertension was 20.9%, with 6.7% classified as severe or uncontrolled. Abnormal glucose metabolism affected 18.5% of participants, including 10.8% with impaired fasting glucose and 7.7% with diabetes-level readings. The mean BMI was 24.0 kg/m², with 25.2% overweight and 14.0% obese. Prevalence of both conditions increased with age. The study highlights a substantial burden of hypertension and diabetes in rural Ghana, alongside significant gaps in early detection and management. Strengthening primary healthcare systems, expanding community-based screening, and improving targeted health education are essential to addressing this burden. |
|
1. Introduction
For many adults in rural Ghana, the initial diagnosis of hypertension or diabetes often occurs not through routine screening but at the point of acute medical crisis; following a stroke, a sudden collapse during daily labor, or the progression of a non-healing foot ulcer that necessitates urgent hospital care. Health professionals in district-level facilities consistently report a recurring pattern: patients present with severely elevated blood pressure or markedly high blood glucose levels. [1] [2] In settings where individuals are accustomed to tolerating illness until it significantly disrupts productivity, such late presentations are not isolated incidents but rather indicative of deeper structural deficiencies within the healthcare system.
Data from recent Ghana STEPS surveys show that about 1 in 5 adults has hypertension, and around 6% have diabetes, with similar or higher prevalence in some rural areas.[3] However, a substantial proportion of affected individuals remain unaware of their condition, and among those diagnosed, only a minority achieve sustained disease control.[4] [5] This gap between awareness and proper disease management, often called the “knowing-doing” gap, highlights important weaknesses in Ghana’s primary healthcare system. It raises concerns about how well the system functions and how effective its financing is, especially in underserved rural areas.
Rural Ghana is an important setting for studying these issues. Nearly half of the population lives in rural areas, where access to formal healthcare is mainly provided through Community-based Health Planning and Services (CHPS) compounds and small health posts. [6] [7] While these facilities have played a key role in improving maternal and child health, they were not originally set up to manage long-term conditions like hypertension and diabetes. As a result, many facilities lack basic diagnostic equipment, such as working blood pressure monitors and glucometers, and have insufficient trained staff to provide ongoing care for non-communicable diseases (NCDs). [8] Although Ghana’s National Health Insurance Scheme (NHIS) is designed to support low-income populations, having insurance does not always mean people can access the care they need. In practice, many facilities lack diagnostic services, laboratory testing, and a consistent supply of essential medicines. As a result, patients often face medicine shortages and informal fees, and still have to pay out of pocket.
Economic conditions in rural areas also affect how people seek care. Most households rely on small-scale farming, petty trading, or seasonal work, which provide irregular income. This makes it harder to prioritize care for conditions like hypertension, which often have no obvious symptoms. Seeking care must compete with immediate needs such as food, school fees, and farming costs. When additional barriers, such as transport expenses, time away from work, and medication costs, are added, it becomes difficult for patients to maintain regular follow-up and long-term care. [9] [10] Consequently, many individuals delay care and prioritize treatment only when symptoms become severe or disabling.
A pluralistic health system also influences how people seek care in rural Ghana, where individuals draw on multiple sources of care, including biomedical services, traditional healers, and faith-based providers.[11] Traditional medicine is widely accessible and culturally accepted, with evidence suggesting that up to 80% of the population relies on it for primary healthcare, particularly in rural areas.[12] For conditions with gradual onset and non-specific symptoms, such as hypertension and type 2 diabetes, traditional healers, herbalists, and prayer camps are often the first point of contact.[13] While these providers play important social and cultural roles, reliance on them alone may delay timely utilization of formal biomedical services and diagnosis, especially where beliefs in curative traditional therapies discourage engagement with long-term medical management.[14] It may also lead to delays in diagnosis and treatment, or patients moving between different types of care without a coordinated care pathway, which can affect continuity and effectiveness of care. [15] In this context, hypertension and diabetes are not only medical conditions defined by clinical measurements. In rural Ghana, they are also understood and managed through wider sociocultural beliefs and practices. These local interpretations shape how people explain the causes of illness, what treatments they consider appropriate, and which sources of care they see as legitimate or trustworthy.
The wider effects of this situation go beyond individual health. Hypertension and diabetes primarily affect adults in their most productive years, reducing their capacity to work, lowering productivity, and weakening household economic stability. The costs of long-term management are substantial and are often borne out of pocket, placing significant financial strain on households and caregivers, particularly women and older relatives. [16] These economic pressures can lead to reduced access to healthcare, poor treatment adherence, and broader socioeconomic vulnerability.
At the national level, Ghana faces a double burden of disease, with persistent infectious diseases coexisting alongside a rapidly increasing burden of non-communicable diseases. This dual challenge places considerable pressure on limited health system resources and complicates progress toward achieving Sustainable Development Goals, particularly Target 3.4, which aims to reduce premature mortality from NCDs. Evidence suggests that Ghana’s health systems remain inadequately equipped to address the growing NCD burden alongside infectious diseases, resulting in gaps in service delivery and resource allocation.[17]
Although awareness of these challenges is increasing, there remains limited empirical evidence, especially from rural settings. Existing studies are largely concentrated in urban areas or based on facility-level data, which may not accurately reflect community-level realities. Furthermore, there is a notable gap in studies that integrate epidemiological patterns with social, behavioral, and health system determinants to explain the persistence and poor control of these conditions. Recent reviews highlight a scarcity of comprehensive, regionally representative data, particularly among underserved rural populations.[18]
To address this gap, the study uses hypertension and diabetes as “tracer conditions” to assess both disease burden and the performance of rural health systems. It primarily examines prevalence but also highlights awareness and management of these conditions, while linking the findings to broader socioeconomic and structural factors that shape health outcomes in rural settings.
2. Methodology
The study employed a population-based cross-sectional design with quantitative methods to estimate the prevalence of hypertension and diabetes in remote rural communities in Ghana.
The study was carried out in five rural villages: Ayiti Korpe, Gefia, Atidzive, Lume Avete, and Torve, located in the Akatsi South District of the Volta Region, Ghana. The study population included adults aged 18-75 years who had lived in the communities for at least six months. Individuals who were severely ill, had cognitive impairment, were pregnant, or were unable to provide informed consent were excluded from the study. The minimum sample size was calculated for an infinite population using the standard single proportion formula: n=Z2⋅p⋅(1−p) / E2, where Z = 1.96 (95% confidence), p = 0.50 (maximum variability), and E = 0.05 (margin of error), yielding n = 384. Applying finite population correction for the estimated adult population reduced the requirement to 357. Recruitment of 507 participants exceeded this target, enhancing precision (achieved margin of error <4.5% at 95% confidence) and ensuring adequate statistical power for subgroup analyses.
Data were collected using a pre-tested, structured questionnaire adapted from the WHO STEPS approach. [19] The instrument was piloted to assess clarity, consistency, and reliability prior to the main data collection. The pre-test demonstrated good internal consistency, with a Cronbach’s alpha of 0.78. The questionnaire collected information on participants’ background characteristics (such as age, sex, and education), lifestyle risk factors (including diet, physical activity, tobacco use, and alcohol consumption), and their knowledge, attitudes, and practices regarding hypertension and diabetes. The questionnaires, originally developed in English, were translated into the local Ewe dialect and administered by trained fieldworkers to improve understanding and minimize misclassification of responses.
Standardized clinical procedures were used for measurements. Blood pressure was measured three times using a validated digital sphygmomanometer, and the average of the last two readings was used for analysis to improve reliability. Fasting blood glucose was measured using a point-of-care glucometer through capillary blood sampling. Height and weight were also measured, and body mass index (BMI) was calculated accordingly.
Outcome definitions followed international epidemiological standards. Hypertension was defined as systolic blood pressure ≥140 mmHg and/or diastolic blood pressure ≥90 mmHg, or current use of antihypertensive medication. Diabetes was defined as fasting blood glucose ≥7.0 mmol/L or a prior clinical diagnosis. BMI was categorized using WHO classification guidelines. All behavioral and demographic variables were defined and coded using standard epidemiological criteria to ensure comparability.
Data analysis was conducted using Epi Info (v7.2.6.0) and SPSS (v27). Descriptive statistics, including frequencies, proportions, means, and 95% confidence intervals, were used to summarize participant characteristics and estimate the prevalence of hypertension and diabetes. Variables were grouped into meaningful categories where appropriate, and findings were presented using tables and graphs for clarity. To examine differences in means across age categories within each sex, inferential statistical analysis was used. Participants were stratified by sex, and age was grouped into predefined categories. Within each sex group, a one-way analysis of variance (ANOVA) was performed to test for statistically significant differences in mean across the age categories. Where the ANOVA indicated significant differences, post hoc comparisons were conducted to identify specific group differences. Assumptions of normality and homogeneity of variances were assessed prior to analysis, and a significance level of p < 0.05 was applied.
The study was conducted in accordance with ethical research principles. Participation was voluntary, and confidentiality of all respondents was strictly maintained. Ethical approval was obtained from the Ghana Health Service Regional and District Health Directorates, as well as the EUCLID University Ethical Committee (EC/2024/1129) prior to data collection.
3. Findings
3.1. Summary Demographics of Respondents
The survey included 507 adults aged 18–75 years. Slightly more than half of the participants were women (54.0%). The largest age group was 45–59 years (Figure 1). Overall, educational levels were low. About one in four participants (25.8%) had no formal education. Nearly half (47.5%) had only primary education. A smaller proportion had secondary education (22.7%), and very few had tertiary education (3.9%). Most participants were engaged in farming, which was also their main source of income, reflecting a largely rural, agriculture-based setting. (Figure 1 &Table 5)
3.2. Mean Systolic Blood Pressure Among Respondents
The average systolic blood pressure (SBP) was 128.7 mmHg (SD 17.0; range 86-195), with a median of 128 mmHg and a most common value of 139 mmHg. Overall, SBP increased with age in both men and women. Among women, mean SBP increased steadily from 118.4 mmHg in those aged 18-29 years to 132.4 mmHg in those aged 60-75 years. Among men, SBP rose from 123.4 mmHg in the youngest age group to 132.7 mmHg in those aged 45-59 years, followed by a slight decrease to 131.2 mmHg in the oldest group (Table 1). The differences in mean SBP across age groups were statistically significant for both sexes (p < 0.05), indicating a clear age-related increase. The variation in SBP across age groups was significant among women (p = 0.036) but not among men (p = 0.057), suggesting more variation in blood pressure levels across female age groups (Table 4).
3.3. Mean Diastolic Blood Pressure among respondents
The mean diastolic blood pressure (DBP) was 80.7 mmHg (n = 507; SD 10.3; range 32-135). The median was 82 mmHg, with an interquartile range of 75-87 mmHg, and the most frequently observed value was 88 mmHg. DBP was fairly stable across age groups in both men and women. Among women, mean DBP ranged from 78.2 mmHg in those aged 18-29 years to 81.6 mmHg in those aged 30-44 years (Table 1), with no significant differences between age groups (p > 0.05). Among men, mean DBP varied slightly from 80.1 mmHg in the youngest group to 81.7 mmHg in the oldest group, also without statistically significant differences (p > 0.05). (Table 4)
3.4. Resting Heart Rate (beats per minute)
The mean resting heart rate was 70.8 beats per minute (bpm) (n = 507; SD 10.8; range 45-99), with a median of 70 bpm and an interquartile range of 62-78 bpm. The most common value was 67 bpm. Overall, resting heart rate showed little variation by age or sex. Women had slightly higher heart rates than men in the youngest and oldest age groups, but these differences were small. (Table 1) Among women, the mean heart rate ranged from 68.3 bpm (age 30-44 years) to 72.9 bpm (age 18-29 years), with no statistically significant differences across age groups (p > 0.05). Among men, it ranged from 68.8 bpm (age 18-29 years) to 72.8 bpm (age 30-44 years), also with no significant variation by age (p > 0.05). (Table 4)
3.5. Prevalence of elevated blood pressure (BP ≥140/90 mmHg or on antihypertensive medication)
About one in five adults had elevated blood pressure. Overall, 20.9% (95% CI: 17.6-24.7) had elevated BP, while 79.1% (95% CI: 75.3-82.4) had normal BP. Prevalence increased with age but was similar between women and men. Among women, 20.4% had elevated BP compared with 21.5% of men. By age, the prevalence rose steadily from 3.6% in those aged 18-29 years to 17.9% in 30-44 years, 25.7% in 45-59 years, and 28.3% in 60-75 years (Table 2).
3.6. Prevalence of severe hypertension (BP ≥160/100 mmHg)
Overall, 6.7% of adults (95% CI: 4.8-9.2) had severe hypertension. It was more common in men than in women (8.6% vs 5.1%), although the difference was borderline significant (p = 0.10). Severe hypertension was rare among younger adults (<2%) and peaked in the 45-59 year age group (8.4% overall), reaching 13.0% among men in this age group (Table 2).
3.7. Mean Fasting Blood Glucose among Respondents
The mean fasting blood glucose (FBG) was 5.48 mmol/L (n = 507; SD 2.81). The median was 5.2 mmol/L (IQR: 4.7-5.8), with values ranging from 3.0 to 63.0 mmol/L. The most frequently observed value was 4.9 mmol/L. FBG increased with age in both men and women. Among women, the mean FBG rose from 4.6 mmol/L (SD 0.6) in those aged 18-29 years to 5.6 mmol/L (SD 1.6) in those aged 60-75 years. Among men, it increased from 4.8 mmol/L (SD 0.6) in the youngest group to 6.3 mmol/L (SD 7.6) in the oldest group (Table 3).
3.8. Prevalence of Impaired Fasting Blood Sugar (Prediabetes)
Overall, 10.8% of adults (95% CI: 8.4-13.9) had impaired fasting blood glucose (6.1-6.9 mmol/L or were on diabetes medication), which is about 1 in every 9 adults. No cases were observed among adults aged 18-29 years. Prevalence increased with age, reaching about 16-17% in those aged 60-75 years. It was slightly higher in women than in men (11.7% vs 9.9%), but this difference was not statistically significant (Table 3). These findings show a sizeable group of adults at high risk of developing diabetes if no preventive action is taken. The level of prediabetes (10.8%) is close to the reported diabetes prevalence, meaning that roughly 1 in 4 adults in total has some form of abnormal blood glucose regulation.
3.9. Prevalence of Elevated Fasting Blood Sugar (Diabetes Range)
Overall, 7.7% of adults (95% CI: 5.7-10.3) had fasting blood glucose in the diabetes range (≥7.0 mmol/L or were on diabetes medication). Diabetes was more common in men than in women. No cases were found among adults aged 18–29 years. Prevalence increased with age and was highest in the 45-59 age group (12.3% overall; 19.5% among men) (Table 3).
3.10. Overall Burden of Abnormal Glucose Metabolism
When combining prediabetes and diabetes, 18.5% of adults had abnormal glucose metabolism (10.8% prediabetes and 7.7% diabetes). This means that nearly 1 in 5 adults was affected.
4. Discussion
This population-based study provides compelling evidence that hypertension and diabetes are already firmly established in remote rural Ghana, challenging the long-standing assumption that cardiometabolic diseases are predominantly urban phenomena. The observed prevalence of hypertension (20.9%) and diabetes (7.7%), alongside a substantial burden of impaired fasting glucose (10.8%), indicates an ongoing epidemiological transition in rural settings. Although the prevalence of hypertension is slightly lower than the national estimate (27%), it is still high, especially for a rural population that is often assumed to have protective lifestyle factors such as higher physical activity and less exposure to urban risk factors.[20] [21] In contrast, the diabetes prevalence aligns closely with national estimates (6-9%), suggesting that glycemic disorders are penetrating rural populations at a rate comparable to urban areas. [22] [23] This means that many adults in these communities already fall at different stages of cardiometabolic risk. In simple terms, living in rural areas no longer protects people from chronic diseases, as these conditions are becoming increasingly common even outside urban settings. These findings suggest that rural Ghana is clearly undergoing an epidemiological transition. Non-communicable diseases are no longer confined to location, and patterns observed in rural areas are increasingly similar to those in urban areas.[24]
The Ghana meta-analysis is especially useful as a comparator because it showed that hypertension prevalence in the country has remained persistently high for decades, with little indication of decline, and that awareness, treatment, and control remain poor. [25] [26] Recent regional studies similarly show that hypertension in sub-Saharan Africa is widespread and increasingly common in rural settings across the region, and that a growing recognition is emerging that rural populations are no longer spared as diets, mobility patterns, and age structures change. The current findings align closely with that regional shift.[27]
A particularly important epidemiologic implication is that the hypertension burden in this study is not just prevalent, but likely underdetected in routine care. About one in five respondents (20.5%) had never had their blood pressure checked. Combined with the high prevalence of elevated blood pressure, this suggests that many cases are not being detected in primary care. Evidence from Ghana supports this gap: only about 35% of people with hypertension know they have it, 22% receive treatment, and just 6% have their blood pressure under control. [28] [29] The prevalence estimates, together with low screening coverage, indicate that a substantial proportion of the disease remains undiagnosed in the population. This aligns with evidence that hypertension is increasing in rural Ghana and that risk factors commonly associated with urban living are becoming more common in rural settings. [30] Therefore, a lower observed prevalence compared to the national average should not be interpreted as a lower public health priority. Instead, it likely reflects a mix of the true underlying burden, under-detection of cases, and the possibility that these communities are at an earlier stage in the progression of the epidemic.
The diabetes findings are equally striking and, in some respects, more concerning. The observed prevalence of 7.7% falls within the range reported in studies and is close to recent national and regional estimates. [31] Although some studies report lower national prevalence, higher rates have been observed in certain regions. This variation suggests clear geographic differences in the burden of diabetes and indicates that many cases are likely undiagnosed. Another review across sub-Saharan Africa reported higher prevalence estimates for type 2 diabetes, suggesting that the current estimate is broadly consistent with the wider regional burden.[32] [33] Importantly, the 10.8% prevalence of impaired fasting glucose indicates an even larger pool of people at imminent risk of progression, which means the present burden understates the likely future burden unless prevention and early detection improve. Epidemiologically, this is a classic warning signal: a community with modest current diabetes prevalence but a sizable prediabetes reservoir is one in which incidence may accelerate rapidly if conditions remain unchanged.[34]
The diabetes findings are particularly important because they challenge the older idea that rural populations are largely protected from diabetes due to higher physical activity and lower consumption of processed foods. Recent evidence from Ghana no longer supports this assumption. Although diabetes has traditionally been more common in urban areas, the difference between urban and rural settings is narrowing, and rural populations are increasingly affected. The current results align with this pattern and suggest that remote rural communities may be entering a stage where diabetes is becoming an established chronic condition rather than an emerging urban-only problem. This is especially concerning because diabetes in rural areas is often diagnosed late, poorly monitored, and inconsistently treated due to limited access to health services and financial constraints. As a result, even when prevalence levels appear similar to national averages, the actual level of disease control in rural settings is likely to be much worse.[35]
The finding that 10.8% of adults have impaired fasting glucose should be interpreted with caution. In epidemiology, prediabetes is not a harmless middle stage; it reflects early metabolic risk and a high likelihood of progressing to diabetes. In rural settings where routine screening and follow-up are limited, this proportion points to a large unmet need for prevention and early detection. It also suggests that many people in the early stages of abnormal glucose regulation are likely not being identified through existing health facility data. Evidence from sub-Saharan Africa supports this, showing that cardiometabolic conditions are common but often diagnosed late, when complications may already be developing. Overall, these findings should not be viewed only as current prevalence, but as an indication of a growing future burden of diabetes in the population.
Overall, the patterns of hypertension and diabetes in this study reflect a broader shift in rural health. The coexistence of hypertension (20.9%), diabetes (7.7%), and impaired fasting glucose (10.8%) shows that remote rural Ghana is no longer protected from non-communicable diseases.
Instead, it is increasingly experiencing the same cardiometabolic disease pattern seen in urban and peri-urban areas. Evidence from Ghana and across sub-Saharan Africa shows that living in rural areas no longer means low risk. The burden is now largely driven by population ageing, changes in diet, alcohol use, increasing obesity, and the narrowing difference between rural and urban lifestyles. [36] [37]
5. Conclusion and Recommendations
This study shows that hypertension and diabetes are already common in remote rural Ghana. However, the main problem is not only the number of people affected, but also major weaknesses along the care pathway. Many adults have never been screened, a large proportion of cases remain undiagnosed, treatment coverage is low, and even those on treatment often have poor disease control. Overall, primary healthcare services are available but do not yet provide continuous, effective long-term management of chronic diseases.
For governmental organizations, several policy priorities are clear. First, support should go beyond awareness-raising to strengthen primary healthcare systems for integrated, long-term NCD care. This includes full implementation of the WHO PEN approach, with routine screening, standard treatment protocols, and task-sharing at the primary care level. Second, financial barriers must be reduced through stronger financial protection, since out-of-pocket costs for care and medicines limit sustained treatment. Third, community-based screening and referral systems should be expanded to detect the large number of undiagnosed cases, especially among people who rarely use health facilities. Fourth, reliable supply chains for essential medicines and diagnostic tools are needed to ensure uninterrupted care. Finally, all interventions should prioritize equity by focusing on rural and low-income populations. Strengthening a continuous, affordable, and proactive primary care system is essential for improving long-term control of chronic diseases in these communities.
6. Conflict of Interest
The author states that there is no conflict of interest.
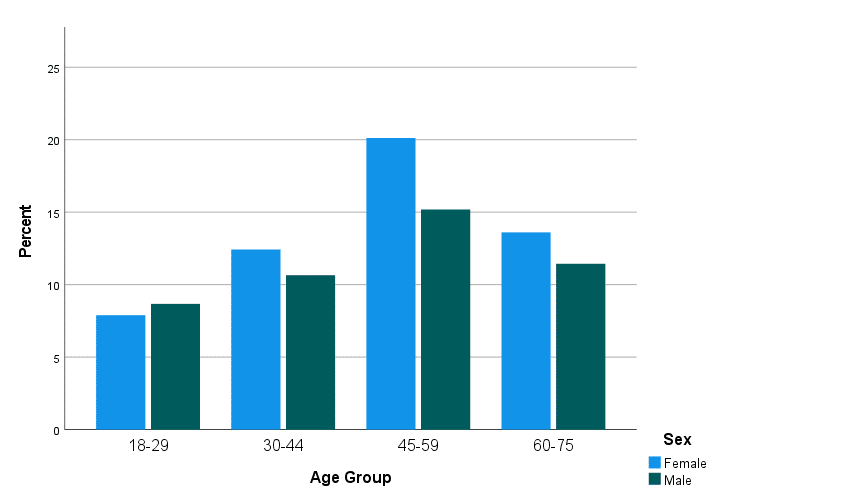
Figure 1: Bar chart showing all respondents by sex and age group
Table 1: Mean Systolic and Diastolic Blood Pressure and Resting Heart Rate by Age Group and Sex
| Age Group (years) | Sex | N | Systolic BP,
Mean (95% CI) |
Diastolic BP,
Mean (95% CI) |
Resting Heart Rate (bpm),
Mean (95% CI) |
| 18–29 | Men | 44 | 123.4 (119.6–127.2) | 80.1 (78.0–82.2) | 68.8 (65.5–72.1) |
| Women | 40 | 118.4 (114.6–122.2) | 78.2 (76.1–80.3) | 72.9 (69.2–76.6) | |
| Both sexes | 84 | 121.0 (118.3–123.7) | 79.2 (77.7–80.7) | 70.8 (68.4–73.2) | |
| 30–44 | Men | 54 | 130.4 (126.0–134.8) | 80.5 (77.2–83.8) | 72.8 (70.1–75.5) |
| Women | 63 | 126.3 (122.3–130.3) | 81.6 (78.8–84.4) | 68.8 (65.7–70.9) | |
| Both sexes | 117 | 128.2 (125.3–131.1) | 81.1 (79.1–83.1) | 70.4 (68.5–72.3) | |
| 45–59 | Men | 77 | 132.7 (128.6–136.8) | 81.5 (79.0–84.0) | 71.0 (68.6–73.4) |
| Women | 102 | 128.7 (125.5–131.9) | 79.6 (77.5–81.7) | 71.7 (69.6–73.8) | |
| Both sexes | 179 | 130.4 (127.9–132.9) | 80.1 (79.0–81.8) | 71.4 (70.1–72.7) | |
| 60–75 | Men | 58 | 131.2 (126.5–135.9) | 81.7 (79.3–84.1) | 69.6 (66.6–72.6) |
| Women | 69 | 132.4 (128.0–136.8) | 81.4 (79.2–83.6) | 70.9 (68.4–73.4) | |
| Both sexes | 127 | 131.9 (128.5–135.3) | 81.5 (79.8–83.2) | 70.3 (68.5–72.1) | |
| 18-75 | Men | 233 | 129.7 (127.5–131.9) | 81.1 (79.7–82.5) | 70.7 (69.3–72.1) |
| Women | 274 | 127.8 (125.8–129.8) | 80.3 (79.7–81.5) | 70.9 (69.6–72.2) | |
| Both sexes | 507 | 128.7 (127.2–130.2) | 80.7 (79.8–81.6) | 70.8 (69.9–71.7) |
Notes. SBP = systolic blood pressure; DBP = diastolic blood pressure; CI = confidence interval. Values are presented as means with 95% confidence intervals.
Table 2: Prevalence of Elevated and Severe Elevated Blood Pressure by Age Group and Sex
| Age Group (years) | Sex | N | %
Elevated BP (95% CI) |
N | %
Severe Elevated BP (95% CI) |
| 18–29 | Men | 3 | 6.8 (2.3–18.2) | 1 | 2.3 (0.4–11.8) |
| Women | 0 | 0.0 (0.0–8.8) | 0 | 0.0 (0.0–8.8) | |
| Both | 3 | 3.6 (1.2–10.0) | 1 | 1.2 (0.2–6.4) | |
| 30–44 | Men | 9 | 16.7 (9.1–28.6) | 5 | 9.3 (4.0–20.0) |
| Women | 12 | 19.0 (11.4–30.1) | 3 | 4.8 (1.6–13.2) | |
| Both | 21 | 17.9 (12.1–25.9) | 8 | 6.8 (3.5–12.9) | |
| 45–59 | Men | 23 | 29.9 (20.7–41.0) | 10 | 13.0 (7.2–22.4) |
| Women | 23 | 22.5 (15.6–31.5) | 5 | 4.9 (2.1–11.0) | |
| Both | 46 | 25.7 (19.9–32.5) | 15 | 8.4 (5.2–13.3) | |
| 60–75 | Men | 15 | 25.9 (16.6–37.7) | 4 | 6.9 (2.7–16.4) |
| Women | 21 | 30.4 (20.8–42.1) | 6 | 8.7 (4.1–17.7) | |
| Both | 36 | 28.3 (21.2–36.8) | 10 | 7.9 (4.4–13.8) | |
| 18–75 | Men | 50 | 21.5 (16.7–27.1) | 20 | 8.6 (5.6–12.9) |
| Women | 56 | 20.4 (16.2–25.5) | 14 | 5.1 (3.1–8.4) | |
| Both | 106 | 20.9 (17.6–24.7) | 34 | 6.7 (4.8–9.2) |
Note. Elevated blood pressure defined as systolic BP ≥140 mmHg and/or diastolic BP ≥90 mmHg or current use of antihypertensive medication. Severe elevated blood pressure defined as systolic BP ≥160 mmHg and/or diastolic BP ≥100 mmHg or use of antihypertensive medication with BP remaining ≥160/100 mmHg. Values are presented as percentages with 95% confidence intervals (CI).
Table 3. Mean fasting blood glucose and prevalence of impaired and elevated fasting blood sugar by age group and sex
| Age
Group (years) |
Sex | N
(FBG) |
Mean FBG (mmol/L)
(95% CI) |
N
(Impaired FBS) |
%Impaired FBS
(95% CI) |
N
(Elevated FBS) |
%
Elevated FBS (95% CI) |
| 18–29 | Men | 44 | 4.80 (4.46–4.98) | 0 | 0.0 (0.0–8.1) | 0 | 0.0 (0.0–8.1) |
| Women | 40 | 4.65 (4.46–4.84) | 0 | 0.0 (0.0–8.8) | 0 | 0.0 (0.0–8.8) | |
| Both | 84 | 4.73 (4.60–4.86) | 0 | 0.0 (0.0–4.3) | 0 | 0.0 (0.0–4.3) | |
| 30–44 | Men | 54 | 5.36 (5.09–5.63) | 5 | 9.3 (4.0–20.0) | 4 | 7.4 (2.9–17.8) |
| Women | 63 | 5.29 (5.09–5.49) | 7 | 11.1 (5.5–21.2) | 1 | 1.6 (0.3–8.5) | |
| Both | 117 | 5.32 (5.17–5.47) | 12 | 10.3 (6.0–17.0) | 5 | 4.3 (1.8–9.6) | |
| 45–59 | Men | 77 | 5.78 (5.50–6.06) | 9 | 11.7 (6.3–20.8) | 15 | 19.5 (12.2–29.5) |
| Women | 102 | 5.52 (5.29–5.75) | 13 | 12.7 (7.7–20.4) | 7 | 6.9 (3.3–13.5) | |
| Both | 179 | 5.63 (5.46–5.80) | 22 | 12.3 (8.2–18.0) | 22 | 12.3 (8.2–18.0) | |
| 60–75 | Men | 58 | 6.33 (4.35–8.31) | 9 | 15.5 (8.4–27.0) | 5 | 8.6 (3.7–18.7) |
| Women | 69 | 5.58 (5.20–5.96) | 12 | 17.4 (10.4–27.7) | 7 | 10.1 (5.0–18.8) | |
| Both | 127 | 5.92 (5.21–6.63) | 21 | 16.5 (11.0–24.0) | 12 | 9.4 (5.5–15.8) | |
| 18–75 | Men | 233 | 5.57 (5.18–5.96) | 23 | 9.9 (6.7–14.4) | 24 | 10.3 (7.0–14.9) |
| Women | 274 | 5.42 (5.25–5.59) | 32 | 11.7 (8.4–16.0) | 15 | 5.5 (3.4–8.8) | |
| Both | 507 | 5.48 (5.24–5.72) | 55 | 10.8 (8.4–13.9) | 39 | 7.7 (5.7–10.3) |
Note: FBG = fasting blood glucose. Impaired FBS defined as 6.1–6.9 mmol/L or on diabetes medication with FBG in this range. Elevated FBS (diabetes range) defined as ≥7.0 mmol/L or on diabetes medication. Percentages are column percentages. Confidence intervals (CI) are at the 95% level.
Table 4: Statistical Differences in Mean Cardiovascular Measures Across Age Groups and Sex
| Variable | Sex | Test Type | p-value | Interpretation |
| Systolic Blood Pressure (SBP) | Women | ANOVA | < .001 | Significant differences across age groups |
| Levene’s test | .036 | Variance inequality present | ||
| Men | ANOVA | < .001 | Significant differences across age groups | |
| Levene’s test | .057 | Variances approximately equal | ||
| Diastolic Blood Pressure (DBP) | Women | ANOVA | .257 | No significant differences |
| Kruskal–Wallis | .230 | No significant differences | ||
| Men | ANOVA | .835 | No significant differences | |
| Kruskal–Wallis | .413 | No significant differences | ||
| Resting Heart Rate
(bpm) |
Women | ANOVA | .144 | No significant differences |
| Kruskal–Wallis | .176 | No significant differences | ||
| Men | ANOVA | .260 | No significant differences | |
| Kruskal–Wallis | .262 | No significant differences |
Note: ANOVA = Analysis of Variance. Levene’s test assesses homogeneity of variances. Kruskal–Wallis test was used where normality assumptions may not hold. Statistical significance was set at p < .05.
Table 5: Sociodemographic Profile and Complete Care Continuum Summary for Hypertension and Diabetes Management
| Domain | Indicator | % | 95% CI |
|
Sociodemographic Characteristics |
Women | 54.0 | 49.7-58.3 |
| Men | 46.0 | 41.7-50.3 | |
| No formal education | 25.8 | 22.2-29.8 | |
| Primary education | 47.5 | 43.2-51.9 | |
| Secondary education | 22.7 | 19.3-26.5 | |
| Tertiary education | 3.9 | 2.6-6.0 | |
| Farmers | 65.1 | 60.8-69.1 | |
| Hypertension | Prevalence: elevated blood pressure | 20.9 | 17.6-24.7 |
| Prevalence: severe hypertension | 6.7 | 4.8-9.2 | |
| Screening: ever had blood pressure measured | 79.5 | 75.8-82.8 | |
| Awareness: prior diagnosis | 20.3 | 17.0-24.0 | |
| Detection gap: undiagnosed among hypertensives | 71.7 | 62.5-79.3 | |
| Treatment: current antihypertensive medication use | 9.3 | 7.1-12.1 | |
| Treatment coverage: among known cases | 31.1 | 23.0-40.5 | |
| Control: controlled among treated cases | 53.1 | 36.4-69.1 | |
| Diabetes | Screening: ever had blood sugar measured | 70.8 | 66.7-74.6 |
| Prevalence: diabetes-range fasting blood sugar | 7.7 | 5.7-10.3 | |
| Prevalence: impaired fasting blood sugar | 10.8 | 8.4-13.9 | |
| Awareness: prior diagnosis | 14.0 | 11.3-17.3 | |
| Detection gap: undiagnosed among diabetics | 76.9 | 61.7-87.4 | |
| Treatment: current glucose-lowering medication use | 1.8 | 0.9-3.3 | |
| Treatment coverage: among known cases | 12.7 | 6.8-22.3 | |
| Monitoring: recent hyperglycemia confirmation among diagnosed | 15.5 | 9.0-25.3 | |
| Control: controlled among treated cases | 0.0 | 0.0-33.6 |
Note. Percentages based on total sample (N = 507) unless otherwise indicated (“among cases”). Bolded cascade steps follow standard WHO/ADA care continuum framework (screening → awareness → treatment → control). CI = confidence interval (Wilson method).
References
Alhassan, Yakubu, Adwoa Oforiwaa Kwakye, Andrews K. Dwomoh, et al. ‘Determinants of Blood Pressure and Blood Glucose Control in Patients with Co-Morbid Hypertension and Type 2 Diabetes Mellitus in Ghana: A Hospital-Based Cross-Sectional Study’. PLOS Global Public Health 2, no. 12 (2022): e0001342. https://doi.org/10.1371/journal.pgph.0001342.
Ataklte, Feven, Sebhat Erqou, Stephen Kaptoge, Betiglu Taye, Justin B. Echouffo-Tcheugui, and Andre P. Kengne. ‘Burden of Undiagnosed Hypertension in Sub-Saharan Africa: A Systematic Review and Meta-Analysis’. Hypertension 65, no. 2 (2015): 291–98. https://doi.org/10.1161/HYPERTENSIONAHA.114.04394.
Attidigah, Reginal Enam Gibril, Elorm Adzikah, Rose Mawufemor Glover, et al. ‘Prevalence and Predictors of Diabetes Distress in Volta Region, Ghana: A Health Facility-Based Cross Sectional Study’. Preprint, In Review, 7 August 2025. https://doi.org/10.21203/rs.3.rs-7077270/v1.
Babagoli, Masih A., Dorothy Adu-Amankwah, Engelbert A. Nonterah, et al. ‘Sociodemographic and Behavioral Factors Associated With Hypertension and Depression in 4 Rural Communities in Northern Ghana: A Cross-Sectional Study’. Journal of Primary Care & Community Health 15 (January 2024): 21501319241242965. https://doi.org/10.1177/21501319241242965.
Bosu, William Kofi, and Dary Kojo Bosu. ‘Prevalence, Awareness and Control of Hypertension in Ghana: A Systematic Review and Meta-Analysis’. PLOS ONE 16, no. 3 (2021): e0248137. https://doi.org/10.1371/journal.pone.0248137.
Brenyah, Joseph Kwasi, Yeetey Enuameh, Bernard Okoe-Boye, et al. ‘Factors Associated with Hypertension and Diabetes in Rural Communities in the Asante Akim North Municipality of Ghana’. Health Open Research 6 (February 2024): 8. https://doi.org/10.12688/healthopenres.13499.1.
Colecraft, Esi K., Matilda Asante, Aaron K. Christian, and Seth Adu-Afarwuah. ‘Sociodemographic Characteristics, Dietary Practices, and Nutritional Status of Adults with Hypertension in a Semi-Rural Community in the Eastern Region of Ghana’. International Journal of Hypertension 2018 (July 2018): 1–7. https://doi.org/10.1155/2018/2815193.
Cook-Huynh, Mariana, Daniel Ansong, Rachel Christine Steckelberg, et al. ‘Prevalence of Hypertension and Diabetes Mellitus in Adults from a Rural Community in Ghana’. Ethnicity & Disease 22, no. 3 (2012): 347–52.
Flood, David, Pascal Geldsetzer, Kokou Agoudavi, et al. ‘Rural-Urban Differences in Diabetes Care and Control in 42 Low- and Middle-Income Countries: A Cross-Sectional Study of Nationally Representative Individual-Level Data’. Diabetes Care 45, no. 9 (2022): 1961–70. https://doi.org/10.2337/dc21-2342.
Geldsetzer, Pascal, Jennifer Manne-Goehler, Maja-Emilia Marcus, et al. ‘The State of Hypertension Care in 44 Low-Income and Middle-Income Countries: A Cross-Sectional Study of Nationally Representative Individual-Level Data from 1·1 Million Adults’. The Lancet 394, no. 10199 (2019): 652–62. https://doi.org/10.1016/S0140-6736(19)30955-9.
Ghana Health Service. GHANA STEPS REPORT 2023: NATIONWIDE NON-COMMUNICABLE DISEASES RISK FACTORS ASSESSMENT USING THE WORLD HEALTH ORGANIZATION’S STEPWISE APPROACH IN GHANA. GHS Press, 2024. file:///C:/Users/user/Downloads/ghana-2023-steps-report.pdf.
Ghana Statistical Service, GSS. ‘Ghana Population and Housing Census: General Report, Volume 3A – Demographic Characteristics’. Ghana Statistical Service, 2021.
Grijalva-Eternod, Carlos Salvador, Kojo Mensah Sedzro, Kafui Adjaye-Gbewonyo, et al. ‘Prevalence of Diabetes and Associated Risk Factors in Ga Mashie, Accra, Ghana – the CARE Diabetes Community-Based Survey’. Preprint, Public and Global Health, 18 March 2024. https://doi.org/10.1101/2024.03.15.24304379.
Hinneh, Thomas, Bernard Mensah, Oluwabunmi Ogungbe, Jonathan Bayuo, Emmanuel Timmy Donkoh, and Yvonne Commodore-Mensah. ‘Prevalence of Suboptimal Blood Pressure, Glycemic Control, and Associated Factors among Patients with Diabetes and Hypertension in Primary Health Care Facilities in Ghana: A Multicenter Retrospective Cross-Sectional Study’. BMC Primary Care 26, no. 1 (2025): 189. https://doi.org/10.1186/s12875-025-02775-4.
Quartey, Theophilus, Charles Peprah, and Anthony Kwame Morgan. ‘Determinants of National Health Insurance Enrolment among People at Risk of Statelessness in the Awutu Senya East Municipality and Gomoa East District of Ghana’. BMC Health Services Research 23, no. 1 (2023): 153. https://doi.org/10.1186/s12913-022-08738-0.
Vest, Bonnie M., Linda S. Kahn, Andrew Danzo, et al. ‘Diabetes Self-Management in a Low-Income Population: Impacts of Social Support and Relationships with the Health Care System’. Chronic Illness 9, no. 2 (2013): 145–55. https://doi.org/10.1177/1742395313475674.
[1] Joseph Kwasi Brenyah et al., ‘Factors Associated with Hypertension and Diabetes in Rural Communities in the Asante Akim North Municipality of Ghana’, Health Open Research 6 (February 2024): 8, https://doi.org/10.12688/healthopenres.13499.1.
[2] Thomas Hinneh et al., ‘Prevalence of Suboptimal Blood Pressure, Glycemic Control, and Associated Factors among Patients with Diabetes and Hypertension in Primary Health Care Facilities in Ghana: A Multicenter Retrospective Cross-Sectional Study’, BMC Primary Care 26, no. 1 (2025): 189, https://doi.org/10.1186/s12875-025-02775-4.
[3] Ghana Health Service, GHANA STEPS REPORT 2023: NATIONWIDE NON-COMMUNICABLE DISEASES RISK FACTORS ASSESSMENT USING THE WORLD HEALTH ORGANIZATION’S STEPWISE APPROACH IN GHANA (GHS Press, 2024), file:///C:/Users/user/Downloads/ghana-2023-steps-report.pdf.
[4] Ghana Health Service, GHANA STEPS REPORT 2023: NATIONWIDE NON-COMMUNICABLE DISEASES RISK FACTORS ASSESSMENT USING THE WORLD HEALTH ORGANIZATION’S STEPWISE APPROACH IN GHANA.
[5] William Kofi Bosu and Dary Kojo Bosu, ‘Prevalence, Awareness and Control of Hypertension in Ghana: A Systematic Review and Meta-Analysis’, PLOS ONE 16, no. 3 (2021): e0248137, https://doi.org/10.1371/journal.pone.0248137.
[6] GSS Ghana Statistical Service, ‘Ghana Population and Housing Census: General Report, Volume 3A – Demographic Characteristics’, Ghana Statistical Service, 2021.
[7] Ghana Health Service, GHANA STEPS REPORT 2023: NATIONWIDE NON-COMMUNICABLE DISEASES RISK FACTORS ASSESSMENT USING THE WORLD HEALTH ORGANIZATION’S STEPWISE APPROACH IN GHANA.
[8] Hinneh et al., ‘Prevalence of Suboptimal Blood Pressure, Glycemic Control, and Associated Factors among Patients with Diabetes and Hypertension in Primary Health Care Facilities in Ghana’.
[9] Masih A. Babagoli et al., ‘Sociodemographic and Behavioral Factors Associated With Hypertension and Depression in 4 Rural Communities in Northern Ghana: A Cross-Sectional Study’, Journal of Primary Care & Community Health 15 (January 2024): 21501319241242965, https://doi.org/10.1177/21501319241242965.
[10] David Flood et al., ‘Rural-Urban Differences in Diabetes Care and Control in 42 Low- and Middle-Income Countries: A Cross-Sectional Study of Nationally Representative Individual-Level Data’, Diabetes Care 45, no. 9 (2022): 1961–70, https://doi.org/10.2337/dc21-2342.
[11] Amos K. Laar et al., “Health System Challenges to Hypertension and Related Non-Communicable Diseases Prevention and Treatment: Perspectives from Ghanaian Stakeholders,” BMC Health Services Research 19, no. 1 (October 2019): 693, https://doi.org/10.1186/s12913-019-4571-6.
[12] Eva Krah, Johannes de Kruijf, and Luigi Ragno, “Integrating Traditional Healers into the Health Care System: Challenges and Opportunities in Rural Northern Ghana,” Journal of Community Health 43, no. 1 (February 2018): 157–63, https://doi.org/10.1007/s10900-017-0398-4.
[13] P. M. Amegbor, “An Assessment of Care-Seeking Behavior in Asikuma-Odoben-Brakwa District: A Triple Pluralistic Health Sector Approach,” SAGE Open 7, no. 2 (2017): 2158244017710688–2158244017710688.
[14] Laar et al., “Health System Challenges to Hypertension and Related Non-Communicable Diseases Prevention and Treatment.”
[15] Brenyah et al., ‘Factors Associated with Hypertension and Diabetes in Rural Communities in the Asante Akim North Municipality of Ghana’.
[16] Samuel Amon et al., “Household Economic Burden of Type-2 Diabetes and Hypertension Comorbidity Care in Urban-Poor Ghana: A Mixed Methods Study,” BMC Health Services Research 24, no. 1 (September 2024): 1028, https://doi.org/10.1186/s12913-024-11516-9.
[17] Joseph Kazibwe et al., “The Epidemiological and Economic Burden of Diabetes in Ghana: A Scoping Review to Inform Health Technology Assessment,” PLOS Global Public Health 4, no. 3 (March 2024): e0001904, https://doi.org/10.1371/journal.pgph.0001904.
[18] Kazibwe et al., “The Epidemiological and Economic Burden of Diabetes in Ghana.”
[19] Ghana Health Service, GHANA STEPS REPORT 2023: NATIONWIDE NON-COMMUNICABLE DISEASES RISK FACTORS ASSESSMENT USING THE WORLD HEALTH ORGANIZATION’S STEPWISE APPROACH IN GHANA (Accra: GHS Press, 2024), file:///C:/Users/user/Downloads/ghana-2023-steps-report.pdf.
[20] Ghana Health Service, GHANA STEPS REPORT 2023: NATIONWIDE NON-COMMUNICABLE DISEASES RISK FACTORS ASSESSMENT USING THE WORLD HEALTH ORGANIZATION’S STEPWISE APPROACH IN GHANA (Accra: GHS Press, 2024), file:///C:/Users/user/Downloads/ghana-2023-steps-report.pdf.
[21] Thomas Hinneh et al., “Prevalence of Suboptimal Blood Pressure, Glycemic Control, and Associated Factors among Patients with Diabetes and Hypertension in Primary Health Care Facilities in Ghana: A Multicenter Retrospective Cross-Sectional Study,” BMC Primary Care 26, no. 1 (May 2025): 189, https://doi.org/10.1186/s12875-025-02775-4.
[22] Ghana Health Service, GHANA STEPS REPORT 2023: NATIONWIDE NON-COMMUNICABLE DISEASES RISK FACTORS ASSESSMENT USING THE WORLD HEALTH ORGANIZATION’S STEPWISE APPROACH IN GHANA.
[23] Albert G. B. Amoah, Samuel K. Owusu, and Samuel Adjei, “Diabetes in Ghana: A Community Based Prevalence Study in Greater Accra,” Diabetes Research and Clinical Practice 56, no. 3 (June 2002): 197–205, https://doi.org/10.1016/S0168-8227(01)00374-6.
[24] William Kofi Bosu and Dary Kojo Bosu, “Prevalence, Awareness and Control of Hypertension in Ghana: A Systematic Review and Meta-Analysis,” PLOS ONE 16, no. 3 (March 2021): e0248137, https://doi.org/10.1371/journal.pone.0248137.
[25] Fidelis Atibila et al., “Prevalence of Hypertension in Ghanaian Society: A Systematic Review, Meta-Analysis, and GRADE Assessment,” Systematic Reviews 10, no. 1 (December 2021): 220, https://doi.org/10.1186/s13643-021-01770-x.
[26] William Kofi Bosu and Dary Kojo Bosu, “Prevalence, Awareness and Control of Hypertension in Ghana: A Systematic Review and Meta-Analysis,” PLOS ONE 16, no. 3 (March 2021): e0248137, https://doi.org/10.1371/journal.pone.0248137.
[27] Shabana Cassambai et al., “Prevalence of Cardiometabolic Diseases in Sub-Saharan Africa: A Systematic Review and Meta-Analysis,” Global Health Action 18, no. 1 (December 2025): 2580758, https://doi.org/10.1080/16549716.2025.2580758.
[28] Fidelis Atibila et al., “Prevalence of Hypertension in Ghanaian Society: A Systematic Review, Meta-Analysis, and GRADE Assessment,” Systematic Reviews 10, no. 1 (December 2021): 220, https://doi.org/10.1186/s13643-021-01770-x.
[29] William Kofi Bosu and Dary Kojo Bosu, “Prevalence, Awareness and Control of Hypertension in Ghana: A Systematic Review and Meta-Analysis,” PLOS ONE 16, no. 3 (March 2021): e0248137, https://doi.org/10.1371/journal.pone.0248137.
[30] Eva L. Van Der Linden et al., “Blood Pressure Change and Hypertension Incidence among Ghanaians Living in Rural Ghana, Urban Ghana and The Netherlands: A Prospective Cohort Study,” eClinicalMedicine 81 (March 2025): 103141, https://doi.org/10.1016/j.eclinm.2025.103141.
[31] Joseph Kazibwe et al., “The Epidemiological and Economic Burden of Diabetes in Ghana: A Scoping Review to Inform Health Technology Assessment,” PLOS Global Public Health 4, no. 3 (March 2024): e0001904, https://doi.org/10.1371/journal.pgph.0001904.
[32] Raylton P. Chikwati et al., “Incident Type 2 Diabetes and Its Risk Factors in Men and Women Aged 40–60 Years from Four Sub-Saharan African Countries: Results from the AWI-Gen Study,” The Lancet Global Health 13, no. 3 (March 2025): e459–66, https://doi.org/10.1016/S2214-109X(24)00520-5.
[33] Bin Zhou et al., “Worldwide Trends in Diabetes Prevalence and Treatment from 1990 to 2022: A Pooled Analysis of 1108 Population-Representative Studies with 141 Million Participants,” The Lancet 404, no. 10467 (November 2024): 2077–93, https://doi.org/10.1016/S0140-6736(24)02317-1.
[34] Joseph Kazibwe et al., “The Epidemiological and Economic Burden of Diabetes in Ghana: A Scoping Review to Inform Health Technology Assessment,” PLOS Global Public Health 4, no. 3 (March 2024): e0001904, https://doi.org/10.1371/journal.pgph.0001904.
[35] Joseph Kazibwe et al., “The Epidemiological and Economic Burden of Diabetes in Ghana: A Scoping Review to Inform Health Technology Assessment,” PLOS Global Public Health 4, no. 3 (March 2024): e0001904, https://doi.org/10.1371/journal.pgph.0001904.
[36] Shukri F. Mohamed et al., “Prevalence, Awareness, Treatment and Control of Hypertension and Their Determinants: Results from a National Survey in Kenya,” BMC Public Health 18, no. S3 (November 2018): 1219, https://doi.org/10.1186/s12889-018-6052-y.
[37] Neema R. Mosha et al., “Prevalence,Awareness and Factors Associated with Hypertension in North West Tanzania,” Global Health Action 10, no. 1 (January 2017): 1321279, https://doi.org/10.1080/16549716.2017.1321279.