
Abstract:
Malaria transmission in Ethiopia’s highland urban zones is undergoing a resurgence driven by climate variability, urban growth, and ecological disturbance. Once considered low-risk due to its elevation, Addis Ababa has recently experienced increasing malaria cases, emphasizing the need for climate-informed analysis.
This study assessed associations between meteorological factors and malaria prevalence in Addis Ababa from 2019 to 2023. Weekly malaria data from five sub-cities were analyzed alongside minimum and maximum temperature, precipitation, and humidity using negative binomial regression across 0-, 4-, and 8-week lag intervals. Model performance was evaluated with Variance Inflation Factor (VIF), Cronbach’s alpha, and goodness-of-fit statistics.
Malaria prevalence rose by 126% from 2021 to 2022 and by 71% from 2022 to 2023, with Akaki Kality recording the highest rate (16.7 per 1,000 population). Minimum temperature was positively associated with malaria (+7.9%, p=0.004), whereas maximum temperature (−15.4%, p<0.001) and precipitation (−3.03%, p=0.001) showed inverse relationships. Lagged analyses confirmed temporal consistency, while humidity showed no significant effect.
The findings indicate that malaria transmission in Addis Ababa’s highland zones is increasingly climate-sensitive. Integrating meteorological data into surveillance and adopting altitude-specific, climate-adaptive vector control strategies are essential for sustaining Ethiopia’s malaria elimination efforts.
1. Introduction
Malaria remains a major public health and socioeconomic burden across Ethiopia despite notable progress in reducing malaria incidence over the past two decades. In addition to causing significant morbidity and mortality, malaria disproportionately affects rural communities where over 80% of Ethiopia’s population resides by driving worker absenteeism during peak transmission seasons and disrupting agricultural productivity.[1] National estimates attribute approximately 30% of all disability-adjusted life years (DALYs) to malaria, underscoring its persistent economic impact.[2] Ethiopia’s vulnerability is amplified by the fact that roughly 75% of its landmass is malaria-endemic, home to nearly 69% of its population. Between January and October 2024 alone, over 7.3 million cases and 1,157 deaths were reported.[3] Research on altitude-driven transmission highlights that temperature suitability for malaria vectors increasingly extends into the highland regions a trend closely linked to climate change.”[4]
- Literature review
Historically, Ethiopia has treated malaria control as a top health and development priority, initiating its national malaria program in the 1950s. Eradication efforts formally began in 1966, but civil unrest disrupted vector control operations in the 1980s and 1990s. Renewed commitment followed with Ethiopia’s endorsement of the Abuja Declaration in 2000[5] and the development of the first National Malaria Strategic Plan, resulting in scaled interventions such as widespread distribution of long-lasting insecticidal nets (LLINs), indoor residual spraying (IRS), artemisinin-based combination therapies (ACTs), and rapid diagnostic tools.[6] This led to a marked reduction of malaria morbidity and mortality, with some annual variation as of the rollback malaria era.[7]
However, recent studies show that African highlands, previously considered malaria-free, now face heightened transmission risks due to deforestation, agricultural intensification, and rapid population growth.[8] Studies emphasize the compounded effects of temperature,[9] and rainfall variability.[10] This drives changes in mosquito breeding patterns and epidemic dynamics above altitudes of 1600 meters. Migratory patterns and historical settlement in these highland zones have further facilitated malaria resurgence.[11]
While situated in a highland zone, Addis Ababa faces unique challenges driven by rapid urbanization. Poor drainage infrastructure, peri-urban sprawl, stagnant water around construction sites, and weak public health outreach foster conditions conducive to localized vector proliferation. Limited health-seeking behaviors and uneven access to municipal services amplify urban malaria risks, necessitating tailored intervention strategies sensitive to spatial and infrastructural inequalities.
This study analyzes prevalence and trends and investigates climatic drivers of malaria transmission in newly affected sub-cities of Addis Ababa from 2019 to 2023.
3. Methods
3.1 Study Design and Area
The study was conducted across the sub-cities of Addis Ababa, the capital of Ethiopia, and the country’s economic, political, and cultural hub. Administratively, Addis Ababa is divided into 11 sub-cities, several of which have reported malaria cases in recent years, highlighting the need for a focused assessment of disease prevalence and health system readiness. Geographically, Addis Ababa is situated at 9°1′48″N latitude and 38°44′24″E longitude, with an elevation of 2,355 meters above sea level. The city is at the foot of Mount Entoto, a historically significant highland that influences local climate conditions. Addis Ababa forms part of the watershed of the Awash River, a vital water source for surrounding regions, playing a role in the city’s environmental and ecological dynamics.
According to the Central Statistics Agency (CSA) report of July 2023, Addis Ababa has an estimated population of 3,945,000 residents, with women comprising 2,084,000 (52.8%). The city’s demographic structure, urban expansion, and environmental factors underscore the complexity of malaria transmission patterns and healthcare system challenges in the region.[12]
3.2 Study Population
The study population comprised residents of Addis Ababa within the selected sub-cities. This approach allowed for an evaluation of environmental conditions, such as temperature variations, precipitation levels, and other climate-related changes, that may influence malaria transmission trends in the region. The principal investigator obtained weekly malaria case data for five years (2019–2023) from the Addis Ababa Health Bureau and climate-related data from the Ethiopian Meteorological Agency (EMA) (2019–2023), supported by authorization letters from Euclid University (see Annex V) and the Addis Ababa Health Bureau (see Annex VI). These administrative datasets were accessed through official channels, ensuring credibility and adherence to standardized reporting protocols. The data sources are established institutions with rigorous data collection and validation mechanisms, enhancing reliability and accuracy. Authorization was granted upon presentation of a support letter, reinforcing institutional backing and compliance with data governance standards.
3.3 Statistical analysis
Malaria prevalence and trend data in Addis Ababa were analyzed using SPSS version 30 and Stata Version 18, employing descriptive and inferential statistical techniques. Inferential analyses included linear, binomial, and multiple regression models to explore underlying patterns and relationships within the dataset. The statistical analysis included a weekly trend analysis of malaria cases, a prevalence of malaria per 1,000 people, and a descriptive analysis of meteorological variables. Negative binomial regression analysis was used to examine associations between malaria cases and meteorological factors (precipitation, rainfall, minimum and maximum temperatures, humidity) with time lags of lag 0, lag 1 (4 weeks), and lag 2 (8 weeks).
Negative binomial regression offers several advantages over Poisson regression when modeling count data, particularly when the dependent variable consists of whole numbers. It handles overdispersion better by introducing an additional dispersion parameter, allowing for better model fit. However, Poisson regression assumes that the mean and variance of the dependent variable are equal, which is not the case in many real-world scenarios. Negative binomial regression accounts for this excess variability, producing more reliable estimates and greater flexibility, accommodating a wider range of count distributions, making it more suitable for datasets with high variability or excess zeros.[13]
Different strategies were deployed to enhance reliability, including standardized procedures, maintaining consistent procedures across all data collection points, developing a detailed protocol, and developing standard statistical analysis (Cronbach’s Alpha), which is widely used to evaluate scale reliability, particularly in social sciences and humanities research. There is no clear interpretation of the acceptable Cronbach’s alpha coefficient value range level.
However, Research indicated that an alpha coefficient of 0.90 and above shows a high internal consistency, 0.80-0.89 reflects “strong internal consistency,” 0.70-0.79 reflects “acceptable internal consistency,” 0.60-0.69 indicates a “questionable internal consistency,” and below 0.60 indicates “poor internal consistency.”[14] However, Cronbach’s alpha is sensitive to the number of items in a scale, and lower values are common when the number of items is fewer than ten. Pallant (2020) notes that shorter scales may yield lower alpha values, even when the items are conceptually sound. Therefore, interpretation should consider the nature of the construct being measured and the number of items included.[15]
Model diagnostics were conducted to assess fit and reliability. For the negative binomial model, goodness-of-fit was examined using deviance and Pearson chi-square statistics. Residual plots were reviewed for systematic patterns. Although overdispersion was addressed via the dispersion parameter, zero-inflated alternatives were explored, but no superior fit was found.
Reliability Assessment
The researcher assessed internal consistency on the model included in this study using Cronbach’s alpha: Negative Binomial Regression Model (Malaria Cases vs. Meteorological Variables) yielded a Cronbach’s Alpha of 0.76, which is good.
Multicollinearity Assessment
Multicollinearity was evaluated on the regression model in the study using the Variance Inflation Factor (VIF), a widely recognized diagnostic tool for detecting collinearity among independent variables. The VIF values obtained for the Negative Binomial Regression Model (Malaria Cases vs. Meteorological Variables) yielded a VIF score: 4.05, below 5 and acceptable, considering the interrelatedness of meteorological variables.
Multivariate regression was employed to control potential confounding variables effectively, ensuring that external influences did not distort observed associations between predictors and outcomes.
4. Results
Malaria case data collected from the Addis Ababa Health Bureau were analyzed for trends and prevalence from 2019 to 2023. Weekly data for the four sub-cities were available from 2019 to 2023. Lemikura city Has Data only from 2022 to 2023, because it was established in late 2021. There was no missing weekly data among the five sub-cities. The result shows that the five-year prevalence of malaria was 16.7 per 1000 population in Akaki Kality, 10.44 per 1000 population in Bole sub-city, 3.6 per 1000 in Lemikura sub-city, 5.4 per 1000 in Nifas Silk Lafto, and 4.7 in Yeka sub-city, with an average prevalence rate of 7.4 per 1000 population. The prevalence of malaria increased by 126% from 2021 to 2022 and by 71% from 2022 to 2023. Please see Table 1.
The weekly malaria epidemic curve in Figure 1 indicates that all sub-cities reported fewer malaria cases from 2019 to 2021. However, the number of cases started increasing starting the 13th week of 2022 and reached its highest at the end of 2023 due to different climatic, environmental, and other conditions.
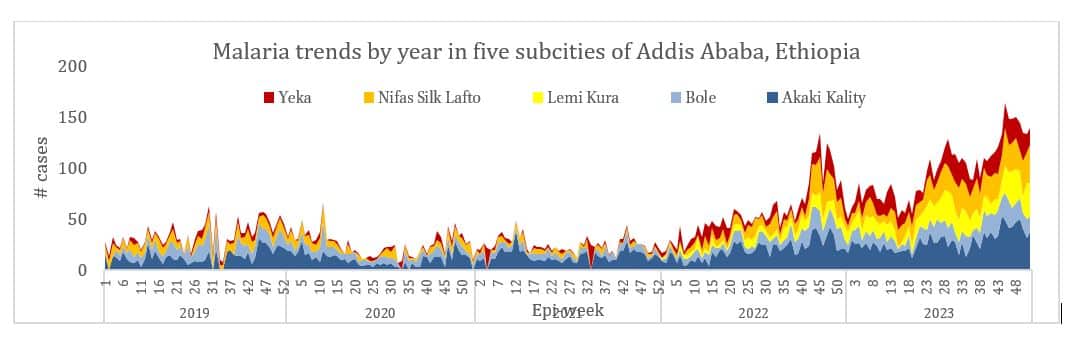
Figure 1: Malaria weekly trends by selected sub-cities in Addis Ababa, Ethiopia, from 2019 to 202
Table 1: Number of malaria cases and prevalence rate by sub-city in Addis Ababa, Ethiopia, from 2019 to 2023
| Subcity | Altitude (m) | 2019 | 2020 | 2021 | 2022 | 2023 | Total cases | Population | IR/1000 Popu. | |
| Akaki Kality | 2132 | 680 | 567 | 726 | 1047 | 1483 | 4503 | 269226 | 16.7 | |
| Bole | 2326 | 484 | 383 | 279 | 525 | 736 | 2407 | 230595 | 10.4 | |
| Lemi Kura | 2510 | 367 | 932 | 1299 | 359911 | 3.6 | ||||
| NS/ Lafto | 2400 | 417 | 295 | 169 | 555 | 1052 | 2488 | 462891 | 5.4 | |
| Yeka | 2324 | 179 | 116 | 137 | 467 | 862 | 1761 | 370897 | 4.7 | |
| Total | 1,760 | 1,361 | 1,311 | 2,961 | 5,065 | 12,458 | 1,693,520 | 7.4 | ||
4.1 Meteorological data overview
The meteorological data obtained from the Ethiopian Meteorological Agency reveals that three distinct stations were responsible for recording daily weather observations. Specifically, Bole and Akaki Subcities maintained individual meteorological stations that captured daily climate variables. In contrast, a single station was designated to monitor atmospheric conditions across Yeka, Nifas Silk Lafto, and Lemikura Subcities, consolidating observations for these areas under a unified dataset.
Regarding data completeness, the records obtained from Yeka Subcity include precipitation, minimum temperature, and maximum temperature measurements; however, this dataset is limited to an eight-month coverage spanning 2022 and 2023. Notably, the dataset lacks recorded observations for humidity, indicating a gap in meteorological monitoring that could affect comprehensive climate assessments for the region.
All sub-cities of Addis Ababa are located above 2000 meters, varying from 2048 up to 3041 meters. All parts of Akaki Kality subcity and part of Nifassilk Lafto subcity are located in the lowest elevation categories, and Yeka and Lemikura sub-cities reside in the highest elevation categories (See Figure 2).
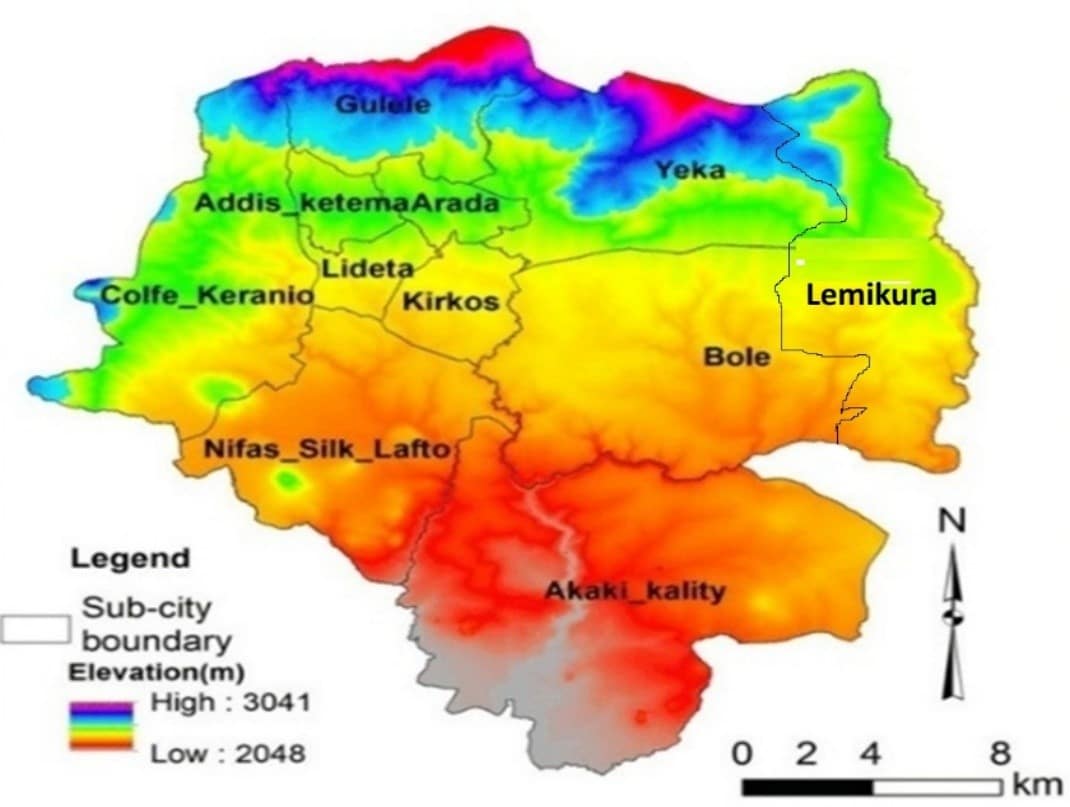
Figure 2: The different altitudes of Addis Ababa sub-cities
4.2 Descriptive analysis
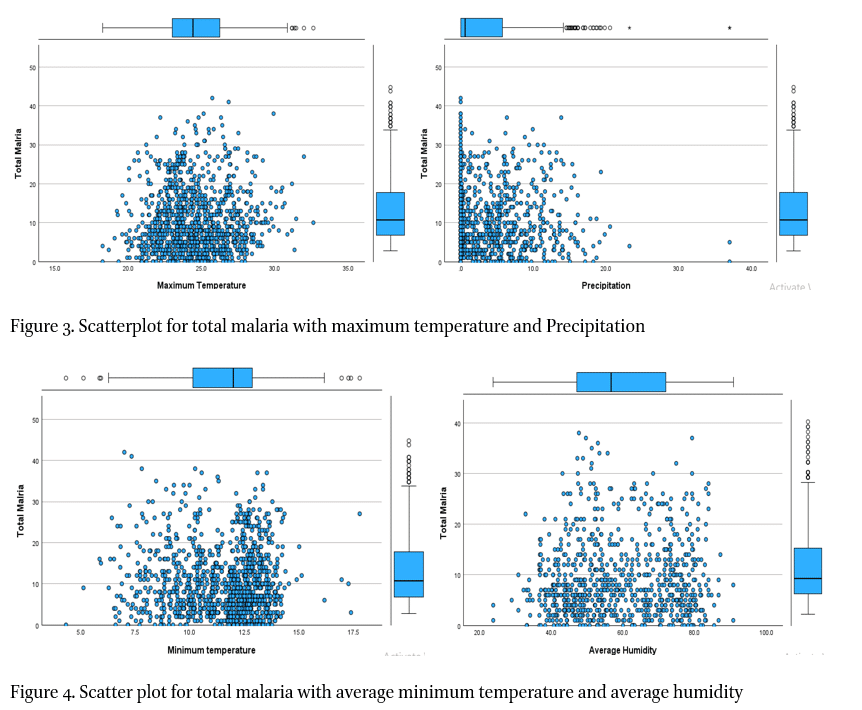
The descriptive analysis of meteorological variables indicates that the mean precipitation was 3.4 mm, with a standard deviation of 4.8. The mean average humidity was 58.9g/m3, with a standard deviation of 14.1. The mean minimum temperature was 11.5 degrees Celsius, with a standard deviation of 1.91. The mean maximum temperature was 24.6 degrees Celsius, with a standard deviation 2.28 (Table 2). Table 4 shows the standard error for the different measurements, including precipitation, average humidity, minimum, and maximum temperatures. Scatterplot for total Malaria with maximum temperature and Precipitation.
Table 2: Descriptive analysis of meteorological variables
|
Table 3: Negative Binomial Regression for malaria and meteorological variables
| Total_malaria | Coef. | Std. Err. | z | P>|z| | [95% Conf. Interval] | |
| Precipitation | -.0303 | 0.009 | -3.38 | 0.001** | -.048 | -.013 |
| Avg_humidity | -.0086 | 0.006 | -1.51 | 0.130 | -.0200 | .003 |
| Min_temp | .0788 | 0.028 | 2.84 | 0.004** | .024 | .1337 |
| Max_temp | -.1536 | 0.033 | -4.65 | 0.001*** | -.218 | -.089 |
| _cons | 5.615 | 0.879 | 6.39 | 0.000 | 3.892 | 7.338 |
*p<0.05, ** p<0.01, ***p<0.001
| Variable | VIF | SQRT VIF | Tolerance | R -squared |
| Precipitation | 2.08 | 1.44 | 0.4805 | 0.5195 |
| Average Humidity | 4.8 | 2.61 | 0.1471 | 0.8529 |
| Min Temp | 2.47 | 1.57 | 0.4044 | 0.5956 |
| Max Temp | 4.86 | 2.2 | 0.2058 | 0.7942 |
| Mean VIF | 4.05 |
Table 4: Variance Inflation Factor Analysis for Climate Variable
The scatter plots in Figure 3 show that most malaria cases occur when the average weekly maximum temperature is between 20 and 30 degrees Celsius. On the other hand, most malaria cases are concentrated when the precipitation is below 15, mostly around zero precipitation. The correlation plots in Figure 4 indicate that most malaria cases were concentrated when the average weekly minimum temperature was between 6 and 14 degrees Celsius, and the average weekly humidity was between 40 and 80 units.
 4.3 Association of malaria prevalence with meteorological variables
A negative binomial regression analysis was applied to evaluate the association between malaria prevalence and meteorological variables, providing insight into how meteorological factors influence disease transmission. The findings indicate a significant inverse relationship between precipitation and malaria prevalence. Specifically, for every unit increase in precipitation, the risk of malaria decreases by 3.03% (p-value = 0.001), highlighting the protective effect of rainfall on malaria transmission. This negative association suggests that increased precipitation may disrupt mosquito breeding habitats by flushing out larvae or altering vector densities, thereby reducing the transmission potential of malaria.
In contrast, average humidity did not statistically correlate significantly with malaria prevalence in this study. While moisture plays a crucial role in mosquito survival and parasite development, the results indicate that variations in humidity alone may not be a determining factor in malaria transmission within the studied context. This could be due to additional interacting environmental variables that mitigate the direct impact of humidity on vector and parasite dynamics.
The hypothesis testing for minimum temperature patterns revealed a statistically significant positive association with malaria prevalence. Specifically, for every unit increase in minimum temperature, the risk of malaria increases by 7.9% (p-value = 0.004), indicating that higher baseline temperatures create favorable conditions for malaria transmission. Warmer minimum temperatures can accelerate the life cycle of Plasmodium parasites within the mosquito vector, leading to increased transmission probability. Additionally, elevated temperatures may prolong the survival of mosquitoes, thereby enhancing vector-host interactions and improving the overall risk of malaria infection.
Similarly, hypothesis testing for maximum temperature patterns revealed a significant negative association with malaria prevalence. For every unit increase in maximum temperature, the risk of malaria decreases by 15.4% (p-value < 0.001). This suggests that excessively high temperatures may adversely affect mosquito survival ability and reproduction, potentially reducing vector populations, which can limit malaria transmission. Extreme heat conditions can also accelerate water evaporation from mosquito breeding sites, disrupting larval development and decreasing the likelihood of sustained transmission.
These findings underscore the complex interplay between meteorological factors and malaria prevalence, suggesting that precipitation and temperature fluctuations significantly influence malaria risk dynamics. Further investigation into the mechanistic pathways by which climatic conditions modulate malaria transmission could provide valuable insights for predictive modeling and vector control strategies, aiding in practical disease mitigation efforts. Please see Table 3 for more information.
Variance Inflation Factor (VIF) analysis was conducted to evaluate multicollinearity and ensure model stability. The mean VIF for the model is 4.05, indicating acceptable levels of collinearity. Table 4 presents the VIF scores for the fitted variables. As shown in the table, all variables have a VIF below five, confirming that multicollinearity does not significantly affect the model.
A negative binomial log-rank regression analysis examined the relationship between malaria prevalence and meteorological factors over lagged periods of four weeks (Lag 1) and eight weeks (Lag 2). The findings indicate that the lagged analysis yielded results consistent with those obtained in the non-lag analysis.
Precipitation exhibited a statistically significant negative association with malaria prevalence. Specifically, for each unit increase in rainfall, the risk of malaria decreased by 3.6% (p-value = 0.003) at Lag 1 and 2.8% (p-value = 0.023) at Lag 2, suggesting an inverse relationship between rainfall and malaria transmission dynamics.
Conversely, average humidity did not demonstrate a statistically significant association with malaria prevalence at either Lag 1 or Lag 2, indicating that humidity alone may not be a critical determinant of malaria risk within the studied timeframe.
The analysis revealed a positive association between malaria prevalence and minimum temperature patterns. For each unit increase in minimum temperature, the risk of malaria increased by 8.5% (p-value = 0.036) at Lag 1 and 7.4% (p-value = 0.041) at Lag 2. This suggests that higher minimum temperatures may contribute to environmental conditions favorable for malaria transmission.
In contrast, maximum temperature demonstrated a negative association with malaria prevalence at Lag 2. Specifically, for each unit increase in maximum temperature, the risk of malaria decreased by 10.9% (p-value < 0.032). However, at Lag 1, the association between maximum temperature and malaria prevalence was not statistically significant, indicating a potential temporal variability in the influence of maximum temperature on malaria transmission dynamics.
These findings underscore the complex interactions between meteorological factors and malaria prevalence, highlighting the need for further investigation into how temperature and precipitation influence malaria transmission dynamics over varying lagged periods. Please see Table 5 for more information.
Table 5: Negative Binomial Regression, Log-rank test at Lag 1 and Lag 2
| Parameter | B | Std. Error | 95% Wald CI | Wald Chi-square | df | Sig | |
| Lower | Upper | ||||||
| (Intercept) | 5.100 | 1.5233 | 2.115 | 8.086 | 11.21 | 1 | <.001 |
| Precipitation Lag1 | -.036 | .0120 | -.059 | -.012 | 9.03 | 1 | .003** |
| Precipitation Lag2 | -.028 | .0125 | -.053 | -.004 | 5.18 | 1 | .023** |
| Humidity Lag1 | -.001 | .0081 | -.017 | .015 | 0.01 | 1 | .912 |
| Humidity Lag 2 | .002 | .0077 | -.013 | .017 | 0.05 | 1 | .829 |
| Min Temperature Lag1 | .085 | .0405 | .005 | .164 | 4.38 | 1 | .036** |
| Min Temperature Lag2 | .074 | .0364 | .003 | .146 | 4.16 | 1 | .041** |
| Max Temperature Lag1 | -.081 | .0525 | -.184 | .022 | 2.37 | 1 | 0.124 |
| Max Temperature Lag2 | -.109 | .0509 | -.209 | -.009 | 4.59 | 1 | .032** |
*p<0.05, ** p<0.01, ***p<0.001
5. Discussion
The five-year malaria prevalence of 7.4 per 1000 mid-year population in the studied sub-cities reflects a low but non-negligible burden, especially considering the high altitude of Addis Ababa. While highland areas are traditionally expected to have lower malaria transmission, the persistence of cases suggests that altitude alone does not act as an absolute barrier to malaria prevalence, particularly in the context of climate variability.
Spatial Disparities in Malaria Prevalence
The notable difference in malaria prevalence between Akaki Kality subcity (16.7 per 1000) and Yeka subcity (4.7 per 1000) raises important questions about microclimatic and ecological influences on transmission dynamics. The altitude difference of approximately 200 meters could contribute to variations in temperature, vector survival, and habitat suitability. Additionally, socioeconomic and infrastructural factors such as differential access to healthcare, housing conditions, and human migration patterns may exacerbate these disparities. These results are consistent with another study, which found increased malaria cases in central highland areas due to a consistent rise in temperature and climate change.[16] These findings align with previous research indicating that endemic malaria in African highlands is an emerging public health challenge, and the identification of malaria clusters in high-elevation villages in northwest Ethiopia.[17][18]
The 126% increase in malaria prevalence from 2021 to 2022 and the 71% increase from 2022 to 2023 signal a worrying trend, likely driven by climate change, inadequate vector control, and weak implementation of preventive strategies. The consistency of these findings with previous studies underscores the growing risk of malaria in highland regions, reinforcing concerns about how warming temperatures may expand malaria transmission zones. Furthermore, the alignment with WHO global malaria trends, which showed an additional 5 million cases in 2022 and 11 million cases in 2023, suggests that these increases are not isolated phenomena but part of a broader shift in malaria epidemiology.[19]
Meteorological Variables and Malaria Risk
The negative binomial regression results provide nuanced insights into how meteorological factors shape malaria transmission: inverse association with precipitation (-3.03%). The significant decrease in malaria risk with increased rainfall supports the hypothesis that heavy rain washes away mosquito larvae and breeding sites, reducing vector density. This finding is consistent with studies in Nigeria, where higher rainfall correlates with lower malaria prevalence.[20] However, the intensity and timing of rainfall remain critical variables, as stagnant water accumulation after rains could still promote breeding.
Temperature variability and malaria prevalence:
Minimum temperature (+7.9%): The positive correlation suggests that warmer nights enhance mosquito survival and biting rates, leading to higher transmission. Maximum temperature (-15.4%): The protective effect of higher daytime temperatures implies that excessive heat may hinder mosquito activity, reduce survival, or dry out larval habitats. The observed non-linear relationship aligns with findings in Asia and Africa, where temperature dynamics influence malaria risks differently based on location-specific climatic conditions.[21],[22]
Interestingly, humidity showed no significant association with malaria prevalence in this study, contradicting previous research that identified high humidity as a favorable factor for mosquito survival and malaria transmission.[23][24] This discrepancy could stem from differences in study methodologies, geographical contexts, and microclimatic variations. In Addis Ababa’s highland setting, other meteorological factors—such as temperature and precipitation—may have a stronger influence on malaria transmission than humidity alone.
Limitation: The study highlights essential insights into malaria and meteorology. However, the climatic analysis relies on observations from three official meteorological stations, which may limit spatial granularity but provide standardized and reliable measurements. Although the authority collects data using standard methods and tools, the absence of independent triangulation with facility-level health records may limit spatial resolution and specificity. Future studies should incorporate diverse data sources, including satellite-derived climate indicators and localized monitoring, to enhance the precision of climate-sensitive malaria forecasting. Inherent limitations of cross-sectional research, and although multivariate adjustments and lag structures were applied, unmeasured confounding may persist.
6. Conclusion and recommendations
This study presents compelling evidence that meteorological variables particularly temperature and precipitation play a decisive role in shaping malaria transmission dynamics in Addis Ababa’s urban highland environment. A significant positive association between minimum weekly temperatures and malaria prevalence indicates that warmer nighttime conditions foster vector survival and parasite development. In contrast, higher maximum temperatures and increased precipitation appear to reduce transmission risks, likely by disrupting mosquito breeding habitats and shortening vector lifespan. These findings emphasize climate patterns’ non-linear and temporally sensitive impact on malaria ecology and warrant further investigation to enhance predictive modeling for highland malaria. As the first comprehensive analysis integrating administrative health surveillance with meteorological data in Addis Ababa, this study captures a notable rise in malaria burden after 2021, peaking in 2023, particularly in low-altitude sub-cities such as Akaki Kality, suggesting altitude-specific vulnerabilities and climate intensification effects consistent with global highland malaria trends.
To address these emerging challenges, the government and IGOs should deploy an interdisciplinary and climate-responsive approach. Governmental and municipal health authorities should establish integrated health–climate surveillance systems that utilize lagged weather indicators to anticipate malaria outbreaks with improved accuracy. Vector control measures must be spatially prioritized, focusing on high-risk zones where environmental degradation and poor infrastructure heighten transmission risks. Urban planning policies should incorporate malaria-sensitive design features, including enhanced drainage systems and mosquito-proof housing in rapidly expanding peri-urban areas.
7. Acknowledgement
The author acknowledges the support of Dr. Zerai Hagos for their invaluable guidance and comprehensive review of the research paper during the preparation of the dissertation process from which this article was published
8. Conflict of Interest
The author declares that there is no conflict of interest.
9. References
Ahmad, Nurhafizah, Fadzilawani Astifar Alias, Muniroh Hamat, and Siti Asmah Mohamed. RELIABILITY ANALYSIS: APPLICATION OF CRONBACH’S ALPHA IN RESEARCH INSTRUMENTS. 2024.
Alemu, Kassahun, Alemayehu Worku, Yemane Berhane, and Abera Kumie. “Spatiotemporal Clusters of Malaria Cases at Village Level, Northwest Ethiopia.” Malaria Journal 13, no. 1 (2014): 223. https://doi.org/10.1186/1475-2875-13-223.
Ali AL-Mosawy, Zahraa AbdulAmeer, and Nadia Abed Habeeb. “Comparing Some Negative Binomial Regression with Simulation.” Salud, Ciencia y Tecnología – Serie de Conferencias 3 (August 2024). https://doi.org/10.56294/sctconf2024.1127.
Amadi, Miracle, and K. K. W. Hasitha Erandi. “Assessing the Relationship between Malaria Incidence Levels and Meteorological Factors Using Cluster-Integrated Regression.” BMC Infectious Diseases 24, no. 1 (2024): 664. https://doi.org/10.1186/s12879-024-09570-z.
CSA-Ethiopia. “Population of Zones and Weredas Projected as of July 2023.” Addis Ababa: CSA, 2023.
Duque, Carolina. “Impact of Aerial Humidity on Seasonal Malaria: An Ecological Study in Zambia.” Malaria Journal 21, no. 325 (2022). https://doi.org/10.1186/s12936-022-04345-w.
Himeidan, Yousif E., and Eliningaya J. Kweka. “Malaria in East African Highlands during the Past 30 Years: Impact of Environmental Changes.” Frontiers in Physiology 3 (2012). https://doi.org/10.3389/fphys.2012.00315.
Kinde, Solomon, Abate Waldetensai, Aleminesh Hailemariyam, and Yonas Wuletaw. “MALARIA VECTOR CONTROL HISTORY AND CHALLENGES IN ETHIOPIA: MINI REVIEW.” Asian Journal of Advances in Medical Science 3, no. 4 (2021).
Lindsay, Stephen W., and Wilfrid J. M. Martens. “Malaria in the African Highlands: Past, Present and Future.” Bulletin of the World Health Organization 76, no. 1 (1998): 33–45.
Liu, Qiao, Yaping Wang, Jie Deng, et al. “Association of Temperature and Precipitation with Malaria Incidence in 57 Countries and Territories from 2000 to 2019: A Worldwide Observational Study.” Journal of Global Health 14 (February 2024): 04021. https://doi.org/10.7189/jogh.14.04021.
Lukwa, Akim Tafadzwa, Richard Mawoyo, Karen Nelwin Zablon, Aggrey Siya, and Olufunke Alaba. “Effect of Malaria on Productivity in a Workplace: The Case of a Banana Plantation in Zimbabwe.” Malaria Journal 18, no. 1 (2019): 390. https://doi.org/10.1186/s12936-019-3021-6.
Lyon, Bradfield, Tufa Dinku, Anita Raman, and Madeleine C Thomson. “Temperature Suitability for Malaria Climbing the Ethiopian Highlands.” Environmental Research Letters 12, no. 6 (2017): 064015. https://doi.org/10.1088/1748-9326/aa64e6.
Ministry of Health- Ethiopia. “ETHIOPIA MALARIA ELIMINATION STRATEGIC PLAN: 2021-2025.” Addis Ababa: MOH, 2020.
Pallant, Julie. SPSS Survival Manual: A Step-by-Step Guide to Data Analysis Using IBM SPSS. Sixth. Open University Press, McGraw-Hill Education, McGraw-Hill House, 2016.
Parham, Paul Edward, and Edwin Michael. “Modeling the Effects of Weather and Climate Change on Malaria Transmission.” Environmental Health Perspectives 118, no. 5 (2010).
Rubuga, Felix K. Potential Impact of Climatic Factors on Malaria in Rwanda between 2012 and 2021: A Time-Series Analysis. 2024.
Ryan, Sadie J., Catherine A. Lippi, and Fernanda Zermoglio. “Shifting Transmission Risk for Malaria in Africa with Climate Change: A Framework for Planning and Intervention.” Malaria Journal 19, no. 1 (2020). https://doi.org/10.1186/s12936-020-03224-6.
Santos-Vega, M. “The Neglected Role of Relative Humidity in the Interannual Variability of Urban Malaria in Indian Cities.” NATURE COMMUNICATIONS 13, no. 533 (2022). https://doi.org/10.1038/s41467-022-28145-7.
Wang, Zengmiao, Yonghong Liu, Yapin Li, et al. “The Relationship between Rising Temperatures and Malaria Incidence in Hainan, China, from 1984 to 2010: A Longitudinal Cohort Study.” The Lancet Planetary Health 6, no. 4 (2022): e350–58. https://doi.org/10.1016/S2542-5196(22)00039-0.
World Health Organization. “Disease Outbreak News: Malaria in Ethiopia.” Accessed May 16, 2025. https://www.who.int/emergencies/disease-outbreak-news/item/2024-DON542.
World Health Organization. “World Malaria Report 2024.” Accessed April 18, 2025. https://www.who.int/teams/global-malaria-programme/reports/world-malaria-report-2024.
Yalew, Amsalu Woldie. “Achievements, Gaps, and Emerging Challenges in Controlling Malaria in Ethiopia.” Frontiers in Tropical Diseases 2 (January 2022): 771030. https://doi.org/10.3389/fitd.2021.771030.
[1] Akim Tafadzwa Lukwa et al., “Effect of Malaria on Productivity in a Workplace: The Case of a Banana Plantation in Zimbabwe,” Malaria Journal 18, no. 1 (2019): 8, https://doi.org/10.1186/s12936-019-3021-6.
[2] Ministry of Health- Ethiopia, “ETHIOPIA MALARIA ELIMINATION STRATEGIC PLAN: 2021-2025,” Addis Ababa: MOH, 2020, 1.
[3] World Health Organization, “Disease Outbreak News: Malaria in Ethiopia,” accessed May 16, 2025, https://www.who.int/emergencies/disease-outbreak-news/item/2024-DON542.
[4] Bradfield Lyon et al., “Temperature Suitability for Malaria Climbing the Ethiopian Highlands,” Environmental Research Letters 12, no. 6 (2017): 6, https://doi.org/10.1088/1748-9326/aa64e6.
[5] Solomon Kinde et al., “MALARIA VECTOR CONTROL HISTORY AND CHALLENGES IN ETHIOPIA: MINI REVIEW,” Asian Journal of Advances in Medical Science 3, no. 4 (2021): 5–7.
[6] Amsalu Woldie Yalew, “Achievements, Gaps, and Emerging Challenges in Controlling Malaria in Ethiopia,” Frontiers in Tropical Diseases 2 (January 2022): 2, https://doi.org/10.3389/fitd.2021.771030.
[7] Kinde et al., “Malaria Vector Control History And Challenges In Ethiopia: Mini Review,” 2.
[8] Stephen W. Lindsay and Wilfrid J. M. Martens, “Malaria in the African Highlands: Past, Present and Future,” Bulletin of the World Health Organization 76, no. 1 (1998): 42.
[9] Sadie J. Ryan et al., “Shifting Transmission Risk for Malaria in Africa with Climate Change: A Framework for Planning and Intervention,” Malaria Journal 19, no. 1 (2020): 9, https://doi.org/10.1186/s12936-020-03224-6.
[10] Paul Edward Parham and Edwin Michael, “Modeling the Effects of Weather and Climate Change on Malaria Transmission,” Environmental Health Perspectives 118, no. 5 (2010): 625.
[11] Yousif E. Himeidan and Eliningaya J. Kweka, “Malaria in East African Highlands during the Past 30 Years: Impact of Environmental Changes,” Frontiers in Physiology 3 (2012): 8, https://doi.org/10.3389/fphys.2012.00315.
[12] CSA-Ethiopia, “Population of Zones and Weredas Projected as of July 2023,” 31.
[13] Zahraa AbdulAmeer Ali AL-Mosawy and Nadia Abed Habeeb, “Comparing Some Negative Binomial Regression with Simulation,” Salud, Ciencia y Tecnología – Serie de Conferencias 3 (August 2024): 4, https://doi.org/10.56294/sctconf2024.1127.
[14] Nurhafizah Ahmad et al., Reliability Analysis: Application Of Cronbach’s Alpha In Research Instruments, 2024, 116.
[15] Julie Pallant, SPSS Survival Manual: A Step-by-Step Guide to Data Analysis Using IBM SPSS, Sixth (Open University Press McGraw-Hill Education McGraw-Hill House, 2016), 3.
[16] Zengmiao Wang et al., “The Relationship between Rising Temperatures and Malaria Incidence in Hainan, China, from 1984 to 2010: A Longitudinal Cohort Study,” The Lancet Planetary Health 6, no. 4 (2022): 350–51, https://doi.org/10.1016/S2542-5196(22)00039-0.
[17] Lindsay and Martens, “Malaria in the African Highlands: Past, Present and Future,” 42.
[18] Kassahun Alemu et al., “Spatiotemporal Clusters of Malaria Cases at Village Level, Northwest Ethiopia,” Malaria Journal 13, no. 1 (2014): 7, https://doi.org/10.1186/1475-2875-13-223.
[19] World Health Organization, “World Malaria Report 2024,” accessed April 18, 2025, https://www.who.int/teams/global-malaria-programme/reports/world-malaria-report-2024.
[20] Miracle Amadi and K. K. W. Hasitha Erandi, “Assessing the Relationship between Malaria Incidence Levels and Meteorological Factors Using Cluster-Integrated Regression,” BMC Infectious Diseases 24, no. 1 (2024): 15, https://doi.org/10.1186/s12879-024-09570-z.
[21] Qiao Liu et al., “Association of Temperature and Precipitation with Malaria Incidence in 57 Countries and Territories from 2000 to 2019: A Worldwide Observational Study,” Journal of Global Health 14 (February 2024): 9–10, https://doi.org/10.7189/jogh.14.04021.
[22] Felix K Rubuga, Potential Impact of Climatic Factors on Malaria in Rwanda between 2012 and 2021: A Time-Series Analysis, 2024, 9.
[23] M. Santos-Vega, “The Neglected Role of Relative Humidity in the Interannual Variability of Urban Malaria in Indian Cities,” NATURE COMMUNICATIONS 13, no. 533 (2022): 4, https://doi.org/10.1038/s41467-022-28145-7.
[24] Carolina Duque, “Impact of Aerial Humidity on Seasonal Malaria: An Ecological Study in Zambia,” Malaria Journal 21, no. 325 (2022): 10–11, https://doi.org/10.1186/s12936-022-04345-w.