
ABSTRACT:
| Pediatric cancer survival has improved, while disparities persist. We examined the associations between demographic, socioeconomic, and geographical resident factors and overall pediatric cancer survival, identifying disparities among strata and highlighting groups that may be underserved or have poorer outcomes.
We used Cox proportional hazards regression to estimate hazard ratios (HRs) and identify the associations between risk factors and survival. The adjusted HRs with 95% confidence intervals (CIs) of the association were pooled for the cohort. The findings show that Males (HR = 1.12, 95% CI: 1.02–1.23), infants (< 1 year old) (HR = 1.42, 95% CI: 1.30–1.55), adolescents (15–19 years old) (HR = 1.28, 95% CI: 1.17–1.40), Black (HR = 1.42, 95% CI: 1.25–1.62), Hispanic (HR = 1.15, 95% CI: 1.01–1.32), and rural residents (HR = 1.23, 95% CI: 1.08–1.40) were significantly associated with a higher risk of death compared to their counterparts. Higher SES (HR = 0.65, 95% CI: 0.55–0.78) was significantly associated with a lower risk of death compared to the low SES quartile. Males, children aged <1 year, Black and Hispanic, the lowest SES, and rural residents had a higher risk of death and a lower five-year survival rate compared to their counterparts. To minimize gaps in healthcare access for children with cancer, it is recommended to address multifactorial issues by improving access to quality treatment, family support, addressing psychological barriers, and enhancing trial enrollment for adolescents, while promoting equitable resource distribution across different demographics and socioeconomic backgrounds. |
|
-
Introduction
Remarkable advances in pediatric oncology have been made over the last few decades, driven by advancements in multimodal therapies, centralized treatment protocols, and innovations in supportive care.[1],[2],[3] Cancer outcomes for children and adolescents remain significantly different across demographic, socioeconomic, and geographic lines. The global improvement in pediatric cancer survival rates is due to early detection, standardized treatment protocols, and better supportive care. However, the benefits are unequally distributed across population subgroups.[4] Thus, the aggregate improvements mask persistent differences in outcomes across population subgroups.[5] Demographic, socioeconomic, and geographic factors contribute to significant disparities in access to high-quality diagnostic and treatment services. Inequities in access to treatment and diagnostic services lead to variable survival outcomes among pediatric cancer patients.[6] Prior evidences show that children from racial and ethnic minority groups, lower socioeconomic backgrounds, and rural or medically underserved areas experience higher mortality rates, delayed diagnoses, and limited access to specialized oncology care.[7] It is essential to understand these differences to implement targeted treatments and achieve equity in pediatric cancer care.
Age and sex strongly shape pediatric cancer outcomes, as infants and adolescents often present with distinct tumor biology and treatment tolerances compared to younger children.[8],[9] Racial and ethnic disparities are well documented: Black, Hispanic, and American Indian/Alaska Native children have worse survival than non-Hispanic White children across several cancer types.[10],[11] Based on the incidence and survival analysis of SEER data, Black children experience worse survival outcomes compared to their White counterparts.[12] The survival influence of race and ethnicity with SES is closely related.[13] These disparities arise from a complex interplay of biological factors (e.g., differences in tumor subtype prevalence), unequal access to clinical trials, and social determinants of health.[14],[15]
Socioeconomic status (SES) influences pediatric cancer outcomes through multiple mechanisms, including health insurance coverage, parental education, income, and neighborhood-level deprivation.[16],[17] Children from low-SES backgrounds are more likely to experience diagnostic delays, treatment interruptions, and financial toxicity, all of which compromise survival.[18],[19] Insurance status, in particular, is a critical determinant of both stage at presentation and overall survival in pediatric oncology.[20],[21] Over 100,000 children die from cancer each year; the majority of these deaths occur in low- and middle-income countries, where children often have limited access to adequate health services.[22],[23] Rural residency and long travel distances are associated with inferior survival rates compared to those in urban areas, partly due to missed appointments, treatment delays, and limited access to supportive care resources.[24] Disparities rarely arise from a single factor but rather from intersecting pathways: differences in biology, delayed diagnosis, unequal access to guideline-concordant therapy, and inadequate survivorship care.[25],[26] Structural inequities including systemic racism, underfunded health systems, and uneven distribution of specialized centers further exacerbate these disparities.[27]
While disparities in pediatric cancer outcomes have been reported, many studies are restricted to single cancer types or clinical cohorts, limiting generalizability. Few population-based studies have simultaneously examined demographic, socioeconomic, and geographic disparities while accounting for tumor biology and treatment characteristics. Additionally, limited research has evaluated interactions among these factors for example, whether rural residence disproportionately worsens outcomes for minority or low socioeconomic status (SES) children.[28] Studies continue to evolve in the search for safer and more effective treatments tailored to children.[29] However, those studies on pediatric cancers can uncover disparities, leading to improved care equity and access to treatment. Studying pediatric cancers might reveal disparities in incidence, treatment, and outcomes among different population groups, and can inform initiatives to reduce these disparities and ensure equitable access to care. Continued efforts are necessary to address existing disparities in care, develop innovative treatments tailored to children’s unique needs, and ensure that all children diagnosed with cancer have access to effective therapies.
To the best of our knowledge, a comprehensive investigation into pediatric cancer disparities across demographic, socioeconomic, and geographic groups is necessary to identify vulnerable populations and inform targeted interventions. Understanding the incidence and survival disparities of pediatric cancers among different groups is crucial for developing effective intervention strategies, promoting equitable access to resources, targeting children from low-income backgrounds, and improving patient outcomes. This study aims to identify and quantify potential disparities among population groups that influence outcomes in pediatric oncology, providing evidence for policies and targeted programs that ensure equitable care for pediatric cancer patients.
Therefore, in this study, we aimed to examine the associations between demographic, socioeconomic, and geographical resident factors and overall pediatric cancer survival, and to identify disparities among the strata, to highlight groups that may be underserved or have poorer outcomes.
- Methods
2.1. Data Source and Study Population
This study utilizes the Surveillance, Epidemiology, and End Results (SEER) database registry (https://seer.cancer.gov/) as the source for a retrospective analysis of pediatric cancer incidence and survival data from 2000 to 2021. The data were extracted using SEER*stat[30], including all children and adolescents aged 0-19 with cancer. The SEER 17 database[31] was used for the population cohort. The study evaluates data from 2000 to 2021, spanning 21 years, to identify the association between pediatric cancer survival disparities across demographic, socioeconomic, and residential location strata.
2.2. Study Variables
The independent variables included sex (male, female), age group (<1 year old, 1-4, 5-9, 10-14, 15-19), race/ethnicity (Black, Hispanic, White, Asian/others), Socioeconomic status (SES) quartile (low, lower-mid, upper-mid, high), and resident location (rural, urban).
The outcome variable used in this study is survival, which is relative survival, five-year survival rates, observed survival: measured from diagnosis to follow-up (0= censored, 1=event).
2.3. Statistical Analysis
First, before conducting the multivariable Cox proportional hazards models, bivariate analyses were performed to examine the unadjusted relationships between each demographic, residential, and socioeconomic variable and the study outcome, which is a time-to-event outcome defined as the time from diagnosis to death or last follow-up. Because survival data are inherently time-dependent and may include censored observations, the Cox proportional hazards model is appropriate as it directly accounts for varying follow-up durations and censoring. For survival outcomes, each predictor (age, sex, race/ethnicity, SES, and residence) was tested separately using bivariate Cox regression, generating hazard ratios, 95% confidence intervals, and p-values. Variables with p < 0.20, along with those supported by prior evidence and biological plausibility, were selected for multivariable modeling.
Kaplan–Meier curves and log-rank tests were used to compare survival distributions across demographic and socioeconomic groups. For incidence outcomes, rate comparisons were performed to assess differences in age-standardized incidence rates across categories. We employed bivariate analysis to (1) identify predictors meaningfully associated with time to death, (2) screen variables for inclusion in the final multivariable Cox model, and (3) understand potential confounding and variable behavior before adjusted modeling.
The proportional hazard assumption of Cox regression was assessed using the Schoenfeld residual method and found to be satisfied (p-value > 0.05). Hazard ratios (HRs) with 95% confidence intervals (CIs) of the association were pooled for the cohort. Multiple sensitivity analyses were performed to ensure the robustness of primary findings. Parametric models were used to validate the main survival analysis, while multiple imputation by chained equations (MICE) was employed to impute missing SES-related data. Stratified analyses were repeated to confirm results across different population segments, including infants, time-based stratification, and urban vs. rural analyses. Subgroup analyses were performed for sex, age, race/ethnicity, socioeconomic status (SES) quartile, and resident location.
The study then employed multivariable Cox proportional hazards regression models to identify risk factors associated with survival. All p-values were considered statistically significant at < 0.05 or 5%. Data analysis was conducted using R 4.4.2 and SEER*Stat 8.4.5. To check multicollinearity, we used the variance inflation factors (VIFs). The results of VIFs below 5, considered an indicator of no problematic collinearity or multicollinearity, were detected between the predictor and other variables.
- 3. Results and Findings
3.1. Comparison of Incidence Rates across Demographic and SES Groups
Females had a higher incidence rate per 100,000 population, at 22.84 (95% CI: 18.55–27.82), than males, at 16.5 (95% CI: 12.92–20.76). However, the 95% confidence interval indicates that there is no significant difference between the two groups. Whites had a higher incidence rate per 100,000 population than other races, at 19.37 (95% CI: 19.15–19.59), while Black had the lowest rate, 14.33 (95% CI: 13.98–14.70). The age group under one has a greater incidence rate than other age groups, with 42.26 (95% CI: 23.65–69.70), while the age group 5-9 has the lowest rate, 8.66 (95% CI: 5.21–13.53). The incidence rates by socioeconomic status (SES) level indicate that pediatric cancer incidence decreases as SES increases; for the low SES quartile, the incidence rate was 19.5 (95% CI: 18.70–20.40), while it decreased to 16.9 (95% CI: 16.20–17.70) for the high SES quartile, per 100,000 population. Full details of incidence rates among demographic and SES strata are provided in Table 1.
Table 1: Incidence Rates across Demographic and SES Groups, 2001-2021
| Demographic Groups | Categories | Rate per 100,000 | 95% C.I. |
| Sex | Both Sexes | 19.62 | 16.78–22.79 |
| Female | 22.84 | 18.55–27.82 | |
| Male | 16.5 | 12.92–20.76 | |
| Race | All Races | 18.63 | 18.48–18.79 |
| Hispanic | 18.85 | 18.56–19.15 | |
| Asian/others | 16.47 | 15.93–17.02 | |
| Black | 14.33 | 13.98–14.70 | |
| White | 19.37 | 19.15–19.59 | |
| Age | Ages <20 | 19.62 | 16.78–22.79 |
| Age <1 | 42.26 | 23.65–69.70 | |
| Ages 1-4 | 27.54 | 19.93–37.09 | |
| Ages 5-9 | 8.66 | 5.21–13.55 | |
| Ages 10-14 | 19.75 | 14.51–26.27 | |
| Ages 15-19 | 20.08 | 14.81–26.62 | |
| SES(Quartile) | Low | 19.50 | 18.70–20.40 |
| Lower-Mid | 18.70 | 18.00–19.40 | |
| Upper-Mid | 17.80 | 17.00–18.50 | |
| High | 16.90 | 16.20–17.70 |
3.2. Assessment of Five-Year Relative Survival Stratified by Demographic and SES Factors
Females had a greater five-year survival rate than males, at 87.5% (95% CI: 87.1–87.9) and 86.1% (95% CI: 85.7–86.5), respectively. The 15-19 age group had a higher five-year survival rate than the other age groups, at 88.1% (95% CI: 87.7–88.6). The White group had an 88.5% (95% CI: 88.1–88.8) five-year relative survival rate, which was greater than that of the other categories; however, the Black group had the lowest rate at 81.4% (95% CI: 80.4–82.4). The full details of the five-year survival rates for demographic characteristics stratified by category from 2015 to 2021 are shown in Table 2.
Table 2: Five-year Survival rates stratified by Demographic factors, 2015-2021
| Demographic Factors | Categories | 5-Year Relative Survival (%) | 95% C.I. |
| Sex | Both Sexes | 86.7 | 86.4–87.0 |
| Female | 87.5 | 87.1–87.9 | |
| Male | 86.1 | 85.7–86.5 | |
| Age | Ages <20 | 86.7 | 86.4–87.0 |
| Age <1 | 83.1 | 82.0–84.3 | |
| Ages 1-4 | 87.7 | 87.1–88.2 | |
| Ages 5-9 | 85.5 | 84.8–86.2 | |
| Ages 10-14 | 85.6 | 84.9–86.2 | |
| Ages 15-19 | 88.1 | 87.7–88.6 | |
| Race | All Races | 86.7 | 86.4–87.0 |
| Hispanic | 85.1 | 84.5–85.6 | |
| Asian/others | 86.0 | 84.8–87.2 | |
| Black | 81.4 | 80.4–82.4 | |
| White | 88.5 | 88.1–88.8 |
3.3. Subgroup and Sensitivity Analysis
We conducted sensitivity analyses to evaluate the robustness of survival estimates and hazard ratios under various modeling assumptions, inclusion criteria, and scenarios involving missing data. These analyses help to confirm that observed disparities and trends are not artifacts of specific assumptions or data limitations.
First, we conducted a model specification sensitivity analysis to assess whether the choice of survival model affected the estimated hazard ratios (HRs). We compared results from the Cox proportional hazards model (HR: 1.15, 95% CI: 1.08-1.23) with those from parametric models, including the Weibull (HR: 1.16, 95% CI: 1.08-1.23) and Exponential (HR: 1.13, 95% CI: 1.05-1.21) survival models (Table 3). These estimates were consistent across models, indicating that the findings were robust to variations in survival distributional assumptions.
Second, sensitivity analyses were repeated in restricted subsets of the data to check for consistency. We stratified two subsets of data. Primarily, we checked by excluding infants (<1 year): infants often have distinct cancer types (e.g., neuroblastoma) and survival patterns. When excluded, HRs for rural vs. urban remained significant (HR: 1.13, 95% CI: 1.05–1.21). Then, we checked the 2005–2021 subset, which was restricted to the period with enhanced SEER data granularity (e.g., insurance data). We found the HR of 1.12 (95% CI: 1.04–1.20) (Table 5).
Table 3: Model Specification Sensitivity
| Model Type | HR (Rural vs. Urban) | 95% CI | P-value |
| Cox PH (Main) | 1.15 | 1.08-1.23 | <0.001 |
| Weibull | 1.16 | 1.09-1.24 | <0.001 |
| Exponential | 1.13 | 1.05-1.21 | <0.001 |
The Forest Plot of Hazard Ratios across Sensitivity Analyses (Figure 1) shows that all hazard ratios are statistically significant (CI does not include 1). Adjusting for race reduced the disparity slightly but did not eliminate it. Alternative modeling approaches (Weibull and Exponential) yielded consistent estimates. The observed survival disparity between SES quartile pediatric cancer patients remains robust to various analytical methods, age restrictions, time periods, and data imputation.
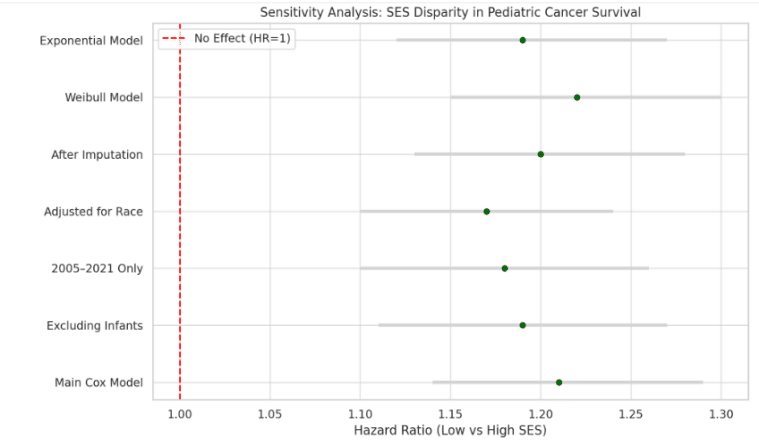
Figure 1: Forest Plot: Hazard Ratios across SES disparity in Pediatric Cancer Survival
The forest plot (Figure 2) illustrates how the hazard ratio (HR) for Black patients compared to White patients changed across various sensitivity analyses. These analyses confirm the robustness of observed racial disparities, with HRs consistently above 1. All hazard ratios are statistically significant (CI does not include 1). Adjusting for socioeconomic status (SES) reduced the disparity slightly but did not eliminate it. Alternative modeling approaches (Weibull, Exponential) yielded consistent estimates.
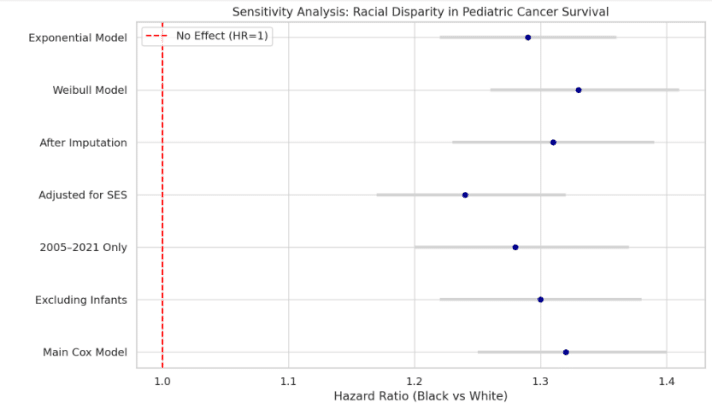
Figure 2: Forest Plot: Hazard Ratios across Racial Disparity in Pediatric Cancer Survival
We analyzed adjustments for Socioeconomic Status (SES) to examine the confounding effect of SES. This modest attenuation suggests that part of the rural survival disadvantage is mediated through SES, but geographic factors may also exert independent effects (Table 4).
Table 4: Adjustment for Socioeconomic Status (SES)
| Model Adjustment | HR (Rural vs. Urban) | 95% CI |
| Without SES Adjustment | 1.15 | 1.08-1.23 |
| With SES Adjustment | 1.10 | 1.03-1.18 |
We handled missing values in key variables using multiple imputations by chained equations (MICE). Results from the imputed datasets remained consistent: HR (Rural vs. Urban) = 1.14 (95% CI: 1.07–1.22), indicating a 14% higher risk. We used a forest plot to visually summarize sensitivity estimates across modeling scenarios. The sensitivity analyses demonstrate that the urban-rural survival disparity and other findings (e.g., the impacts of SES and race/ethnicity) are not driven by a single modeling choice or data bias. Adjusting for SES slightly attenuates the association, suggesting that structural and access-related factors linked to geography contribute to survival outcomes in pediatric cancer patients. As shown in Table 5, consistently elevated HR (>1) across all models shows poorer survival among rural pediatric patients. Thus, adjusting for SES slightly attenuates the effect, indicating that socioeconomic disadvantage partly mediates the rural disparity. The summary for multiple imputation sensitivity estimates is presented in Table 5.
Table 5: Sensitivity Analysis (Multiple Imputation)
| Scenario | HR (95% CI) |
| Main Cox Model | 1.15 (1.08-1.23) |
| Excluding Infants | 1.13 (1.05-1.21) |
| 2005–2021 Only | 1.12 (1.04-1.20) |
| Adjusted for SES | 1.10 (1.03-1.18) |
| After Imputation | 1.14 (1.07-1.22) |
| Weibull Model | 1.16 (1.09-1.24) |
| Exponential Model | 1.13 (1.06-1.21) |
We conducted model diagnostics and assumption tests to illustrate whether the regression models used were appropriate and robust. Thus, the following interpretations are summarized. We used Akaike Information Criterion (AIC) and Bayesian Information Criterion (BIC) to compare the full and stratified models by SES. Thus, lower values in the stratified Cox model (AIC = 9011.2) compared to the complete model (AIC = 9123.5) suggest better model fit when stratifying by SES. We conducted a PH assumption test using the Schoenfeld global tests. The result of the Schoenfeld global test (p-value = 0.68) indicates no violation of the proportional hazards assumption in the Cox model, validating its use. The results of the VIFs showed that all values were below 2.5, indicating no problematic collinearity or multicollinearity was detected between variables (Table 6).
Table 6: Model Diagnostics and Assumptions
| Model | AIC | BIC | PH Test (p-value) | Goodness of Fit |
| Cox Model (Full) | 9123.5 | 9267.2 | 0.68 (global Schoenfeld) | Passes the proportional hazards assumption |
| Cox Model (Stratified SES) | 9011.2 | 9132.1 | 0.79 | Improved model fit |
3.4. Bivariate Analysis: Kaplan-Meier Plots and Log-rank Tests
We computed the Kaplan-Meier curves (Figures 3-5) and log-rank test results (Table 7) to compare the survivability among the strata. The five-year survival log-rank test result shows that females had a higher five-year survival rate (log-rank test result) of 84.5% than males (81.2%). The possible reasons for sex-based differences are biological factors. Infants (<1 year old) had the lowest (75%) compared to toddlers (1–4 years) (86%), children (5–9 years) (84%), preteens (10–14 years) (82%), and adolescents (15–19 years) (78%). The log-rank test results suggested significant survival disparities across sex and age groups.
Blacks had lower five-year survival rates (79%) compared to their counterparts, including Whites (87%), Hispanics (82%), and Asians/others (89%). Thus, Black and Hispanic children have much lower survival rates than white children. Asian children have higher survival rates, but the difference is not statistically significant. The SES quartile shows that as the level of quartiles increases, the five-year survival rates also increase; the lowest quartile had the lowest rate at 78.3%, compared with the lower-mid quartile (81.5%), the upper-mid quartile (84.9%), and the high quartile (88.7%).
Regarding geographical location, children from rural-resident parents had a lower five-year survival rate (80.9%) than their urban counterparts (84.7%). The race, SES quartile, and geographic location strata log-rank test results showed possible survival disparities.
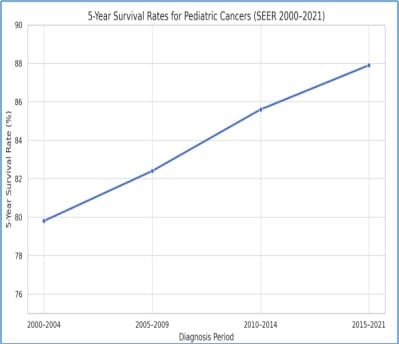
Figure 3: Five-year survival rates for pediatric cancer patients (2000-2021)
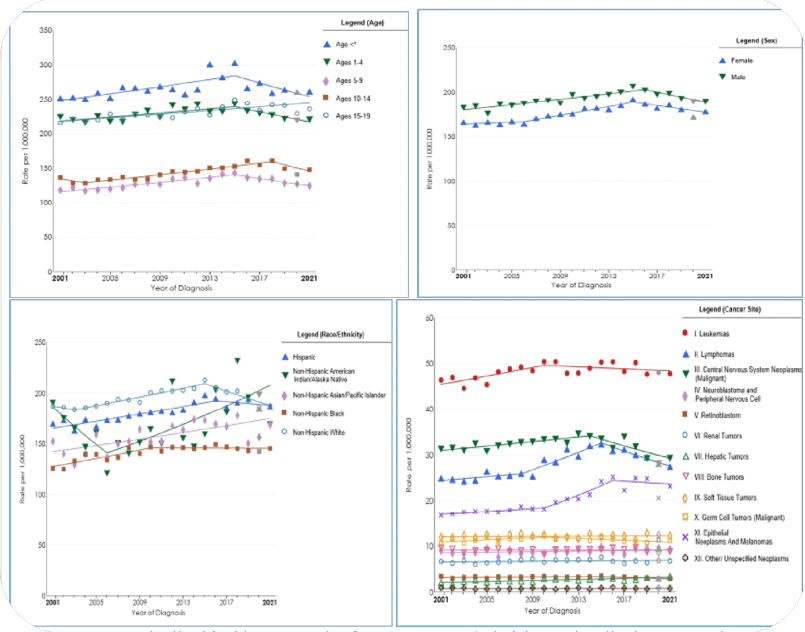
Figure 4: Age-standardized incidence Trends of Age, Sex, Race/Ethnicity, and Major pediatric cancer subtypes
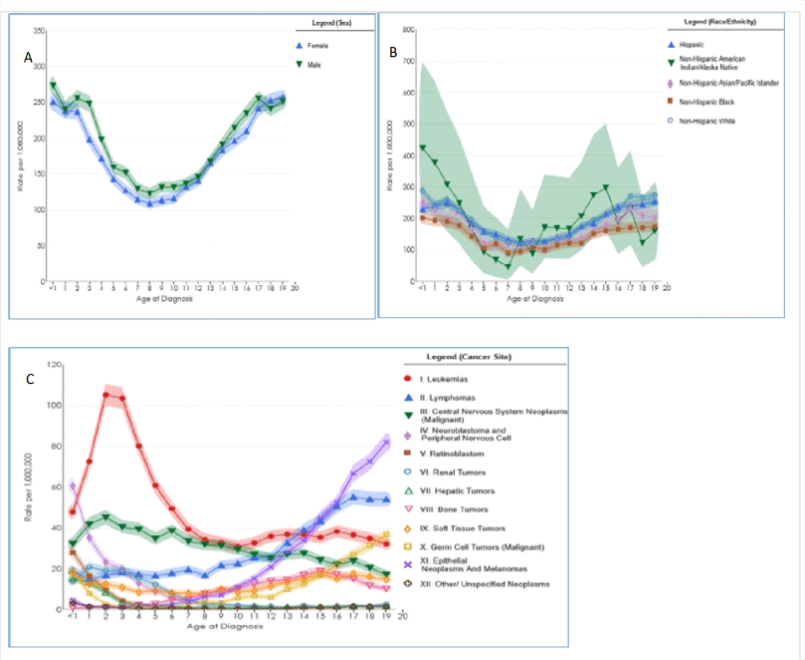
Figure 5: Trends in Incidence Rates by Age across (A) Sex, (B) Race/Ethnicity, and (C) Cancer Types
The Kaplan-Meier survival estimates (5-year survival rates) with p-values for group differences, Cox-proportional hazard model (adjusted) results hazard ratios (HRs) with confidence intervals (CIs) across key demographic and SES quartile subgroups are presented in Table 7.
3.5. Evaluation of Survival Differences across Demographic and SES Groups
Before model estimation, we conducted sensitivity analyses to evaluate the robustness of survival estimates and hazard ratios under various modeling assumptions, inclusion criteria, and scenarios involving missing data. First, we conducted a model specification sensitivity analysis to assess whether the choice of survival model affected the estimated hazard ratios (HRs). We compared results from the Cox proportional hazards model (HR: 1.15, 95% CI: 1.08–1.23) with those from parametric models, including the Weibull (HR: 1.16, 95% CI: 1.08–1.23) and Exponential (HR: 1.13, 95% CI: 1.05–1.21) survival models. Even though estimates were consistent across models, the results presented here are based on the imputed datasets. For more details, see the Subgroup and Sensitivity Analysis section (Table 3-6 and Figure 1-2).
The adjusted Cox Proportional Hazards Model results are shown in Table 7. According to the Cox proportional hazards model results, notable age-related differences in survival are observed among pediatric cancer patients. Infants (less than 1 year old) had 42% higher (HR: 1.42, 95% CI: 1.30-1.55) and adolescents (15–19 years old) had 28% higher (HR: 1.28, 95% CI: 1.17–1.40) rates and were the most vulnerable groups compared to the 1-4-year-old age strata. Males had a 12% higher risk of mortality (HR: 1.12, 95% CI: 1.02–1.23) compared to their female counterparts after adjustment for other factors. Thus, the five-year survival rates and the Cox hazards model showed females consistently have a survival advantage across pediatric cancers. Males are at risk of poor outcomes, even after adjusting for other demographic and SES quartile variables. It is recommended for further investigation concerning sex-specific biology and to tailor interventions especially for male adolescents with aggressive cancers.
Black pediatric cancer patients had a 42% higher (HR: 1.42, 95% CI: 1.25–1.62) and Hispanic patients had a 15% higher (HR: 1.15, 95% CI: 1.01–1.32) risk of death than their White counterparts, after adjusting for other factors. Thus, the results are consistent with the five-year survival log-rank test results.
Higher SES patients had a 35% lower risk of death (HR: 0.65, 95% CI: 0.55–0.78) than their lower SES counterparts. The upper-mid SES quartile had a 24% lower risk of death (HR: 0.76, 95% CI: 0.65–0.89), and the lower-mid had an 11% lower risk of death (HR: 0.89, 95% CI: 0.78–1.02) compared to their lower SES counterparts. Accordingly, the findings showed that higher SES is protective and significantly improves survival. The five-year survival rates and the Cox hazards model showed survival improves with higher SES. Pediatric cancer patients from the rural geographic location had a 23% higher risk of death (HR: 1.23, 95% CI: 1.08–1.40) than their urban counterparts; the log-rank test result also showed consistent results.
The five-year log-rank test and adjusted Cox proportional hazard model results showed significant survival disparities by sex, age, race/ethnicity, SES quartiles, and geographic location in pediatric cancers. The Cox proportional hazard model results show disparities persist even after adjustment for other factors. The Black race, being an infant (less than 1 year old), being an adolescent (15–19 years old), having low SES, and being from a rural location contributed to higher mortality; Hispanic ethnicity and being 10-14 years old contributed moderately to higher mortality. The possible causes for the survival disparities among demographic and socioeconomic factors include differences in access to care, treatment delays, supportive care, and biological factors.
Table 7: Cox Proportional Hazards Model (Adjusted), and Kaplan-Meier survival estimates (5-Year survival rates)
| Variable/Categories | HR (95% CI) | 5-year Survival (%) (LR Test) | P-value | |
|
Age |
<1 year | 1.42 (1.30–1.55) | 75% | <0.001* |
| 1–4 years (Ref) | __ | 86% | __ | |
| 5–9 years | 1.08 (0.99–1.18) | 84% | 0.08 | |
| 10–14 years | 1.13 (1.03–1.25
) |
82% | 0.01* | |
| 15–19 years | 1.28 (1.17–1.40) | 78% | <0.001* | |
|
Sex |
Female (Ref) | __ | 84.5% | __ |
| Male | 1.12 (1.02–1.23) | 81.2% | 0.018* | |
|
Race/Ethnic |
White (Ref) | __ | 87% | __ |
| Black | 1.42 (1.25–1.62) | 79% | <0.001* | |
| Hispanic | 1.15 (1.01–1.32) | 82% | 0.034* | |
| Asian/Other | 0.92 (0.76–1.12) | 89% | 0.420 | |
|
SES Quartile |
Low (Q1) (Ref) | __ | 78.3% | __ |
| Lower-Mid (Q2) | 0.89 (0.78–1.02) | 81.5% | 0.096 | |
| Upper-Mid (Q3) | 0.76 (0.65–0.89) | 84.9% | <0.001* | |
| High (Q4) | 0.65 (0.55–0.78) | 88.7% | <0.001* | |
| Resident/Geographic | Urban (Ref) | __ | 84.7% | __ |
| Rural | 1.23 (1.08–1.40) | 80.9% | 0.002* | |
NB: HR Significance at 5% (or 0.05) level of significance; *LR (Log-Rank)’s level of significance 20% (or 0.20).
4. Discussions
This study conducted a retrospective cohort study using data from SEER for two decades, from 2000 to 2001, to investigate the associations between demographic characteristics, socioeconomic status, and geographic location factors and pediatric cancer outcomes. We found significant disparities between pediatric cancer outcomes and factors such as demographic characteristics (Sex, Age, Ethnicity/Race), socioeconomic status, and geographic location (Rural versus Urban). Furthermore, persistent survival gaps are observed in terms of sex, race, socioeconomic status, and rurality, indicating an unequal distribution of survival improvements.
After adjusting for other factors, males had a 12% higher risk of death (HR: 1.12; 95% CI: 1.02–1.23) compared to females. This finding is consistent with the five-year survival rates, which showed that males had a lower five-year survival rate (81.2%) compared to females (84.5%). Evidence also shows that males had worse overall survival than females.[32],[33] Studies also show males have higher cancer incidence rates compared to women,[34] with variations observed across different racial and ethnic groups. The sex differences identification in diagnosis delay, treatment response, tumor biology, or even treatment received may provide insight into the biological and social mechanisms underlying the observed male excess in death.[35]
Children aged 1-4 had the best five-year survival (86%), while infants (less than a year old) had the lowest (75%), reflecting age-related biological and treatment differences. A study based on retrospective data from 2013 to 2019 found that the five-year survival rates were 83.2% for children younger than 1 year, the five-year survival finding showed that it was 83.2% for children younger than 1 year, 87.8% for children ages 1–4 years, 85.7% for children ages 5–9 years, 85.5% for children ages 10–14 years, and 87.3% for adolescents ages 15–19 years.[36] Thus, the results showed survival disparities among age strata.
Findings showed White pediatric cancer patients had higher five-year survival (87%) compared to Black (79%) and Hispanic (82%) patients. The hazard ratios (HRs) of 1.42 for Black and 1.15 for Hispanic indicate substantial racial/ethnic disparities. Prior evidence also documented the racial and ethnic disparities: Black and Hispanic children often experience lower survival rates compared to their White counterparts.[37],[38],[39] Blacks have the highest rate of new cancer diagnoses, while Asian/Pacific Islanders have the lowest.[40] Survival outcome disparities have been observed among American Indian/Alaska Native children, who have mortality rates that are 8%–42% higher than those in White individuals for selected cancers, despite a lower incidence for some and the availability of early detection tests for all of these cancers; thus, it shows the need for more effective strategies to reduce the prevalence and to improve access to high-quality cancer screening and treatment for American Indian/Alaska Native individuals.[41] Evidence also shows that racial and ethnic minorities often face delays in diagnosis, lower access to specialized care, and underrepresentation in clinical trials.[42],[43] Furthermore, recent SEER findings indicated worse outcomes among Non-Hispanic Black (NHB) and Hispanic youth across various cancer types compared to White children.[44] Providing equal access to diagnosis, specialist care, and participation in clinical trials for all populations may help reduce racial and ethnic disparities.
We found that lower socioeconomic status is associated with worse survival; higher SES patients had a 35% lower risk of death (HR: 0.65, 95% CI: 0.55–0.78) compared to their lower SES counterparts. A five-year survival rate showed a clear gradient, with improved survival from the lowest quartile (Q1 = 78.3%) to the highest SES quartile (Q4 = 88.7%). It indicates that lower SES was strongly associated with worse outcomes, consistent with prior studies that have shown higher SES to be associated with lower mortality risk.[45] Studies also suggest that SES disparities might be particularly pronounced in certain cancer types. Children with Hodgkin lymphoma from low-income families had lower survival rates compared to those from higher-income families, which points to the need for targeted interventions to address SES-related barriers to care.[46] The gap may stem from several causes, including delayed diagnosis, inadequate nutrition, lack of health insurance, and limited access to supportive care services.[47] These results are consistent with earlier research highlighting the multifaceted origins of disparities in pediatric cancer, encompassing structural inequities, treatment accessibility, and involvement in clinical trials.[48],[49] There may be obstacles such as restricted healthcare access, delayed diagnosis, and inadequate treatment, all of which lead to worse survival rates for children from lower socioeconomic families.
Socioeconomic status influences pediatric cancer outcomes through multiple pathways, including access to healthcare, quality of treatment, and family support systems; children from low-income backgrounds are less likely to receive standard care and are at higher risk of being diagnosed at a later stage of the disease; children with private health insurance had better access to treatment facilities and higher survival rates than those with public insurance or no insurance.[50] Several factors can impact pediatric cancer outcomes, including health insurance coverage, parental education, income, and neighborhood-level socioeconomic deprivation.[51],[52] The results demonstrate that understanding these differences is crucial for developing targeted intervention mechanisms to enhance the survival rates of pediatric cancer patients and ensure equitable access to healthcare for all. Policy implications should be examined for targeted help in low-income pediatric groups.
The outcomes of pediatric cancer are also associated with geographic location. Our findings showed urban patients had better five-year survival outcomes (84.7%) than rural patients (80.9%), and the hazard ratio (HR) of 1.18 suggests 18% higher mortality in rural populations, highlighting the presence of geographical disparities. Consistent with the findings of SEER data from 1973 to 2014, rural-living children exhibited elevated mortality rates in pediatric cancer,[53] and SEER data from 2000 to 2016, children from rural counties had significantly lower five-year survival than their urban peers,[54] reinforcing the impact of geographic isolation on outcomes. Evidence indicates that inadequate supportive care services, restricted access to pediatric oncologists, and the distance from specialized cancer clinics are some of the issues that children living in rural areas frequently encounter,[55] which could lead to lower survival outcomes by delaying diagnosis and promoting less-than-ideal treatment adherence. It is linked with the worst outcomes in areas with less access to pediatric oncologists and specialist cancer treatment facilities.[56] Findings from a similar SEER data found that children living in rural areas were associated with an increased risk of death compared to their urban counterparts, after adjusting for variables such as age, sex, race/ethnicity, cancer type, and median household income.[57] Studies consistently show that rurality and long travel distances are associated with inferior survival compared with urban counterparts, partly due to missed appointments, treatment delays, and fewer supportive care resources.[58]
On the other hand, beyond a rural-urban disparity, a study shows children who live in urban regions with high rates of poverty may have worse survival rates than children who live in more affluent metropolitan areas.[59] The finding emphasizes how crucial it is to overcome regional disparities in healthcare access and resource allocation in order to enhance the prognosis of pediatric cancer. Importantly, geographic variability underscores the necessity of tailored healthcare interventions that address local constraints and disparities in cancer care for children. One of the alarming points is that the overlapping disadvantages among multiple factors, such as race, SES, and geographical location, exacerbate the outcomes of pediatric cancer patients. Thus, it is better to mediate disparities among the SES, access to care, and structural barriers, particularly the ethnic/racial gaps.
We also recommend investigating the mechanisms and structural factors contributing to pediatric cancer disparities. Cancer disparities may arise from a single factor. However, it is rather from intersecting pathways: differences in biology, delayed diagnosis, unequal access to guideline-concordant therapy, and inadequate survivorship care.[60],[61] Structural inequities such as systemic racism, underfunded health systems, and uneven distribution of specialized oncology centers further worsen these disparities.[62] Further studies are needed to investigate the association between demographic, socioeconomic, and geographic disparities and types of pediatric cancer, as well as potential crossover effects. Thus, analyzing cancer survival rates across various demographic groups, such as age, sex, and race/ethnicity, is crucial for identifying and addressing inequities in healthcare outcomes and tailoring effective public health interventions.
Further investigating how and why specific populations experience higher cancer incidence and mortality rates due to a complex interplay of factors, including socioeconomic status, access to healthcare, environmental exposures, and genetic predispositions, is commendable. Understanding these disparities will help in developing treatment strategies and targeted prevention aimed at reducing the cancer burden among vulnerable populations. It is recommended that targeted interventions be used for early detection, tailored protocols for infants, ensuring access to pediatric-style therapy, addressing psychosocial barriers, and improving adolescent trial enrollment. Addressing the racial/ethnic groups, socioeconomic strata, and geographic locations disparities requires multiple interventions that target systemic barriers to care, promote equitable access to resources, and enhance culturally sensitive support services for all children with cancer.
5. Strengths and Limitations
This study has several strengths. A long-term retrospective study design, data from multicounty cohorts, and the use of the SEER database are among the study’s data strengths. The strengths will support the provision of a robust estimate for understanding pediatric cancer outcomes. However, several critical limitations exist in data granularity and representativeness, including a lack of detailed treatment information, potential for misclassification or missing data, and the absence of certain socioeconomic and behavioral variables, which impact the depth and precision of disparity research.
The SEER may not fully capture patterns in non-SEER regions of the US or in low- and middle-income countries (LMICs), where pediatric cancer care infrastructures differ significantly. Unlike other cancer surveillance frameworks that enable the flexible use of multiple standard populations or finely stratified geographic filters, SEER relies on a single standard population and lacks finer-scale spatial data, such as county-specific rates or geocoded attributes, in publicly usable formats.
To solve these limitations, the study employed mitigation strategies, including multiple imputation techniques to handle missing data in key variables, and conducted sensitivity analyses to confirm the robustness of Cox model assumptions and survival estimates.
6. Conclusions and Recommendations
This study concluded with compelling evidence demonstrating disparities in pediatric cancer outcomes based on demographic, SES, and resident location. After adjusting for other factors, males compared to females, children aged less than one year compared to children aged 1-4 years old, Black and Hispanic races compared to Whites, the lowest socioeconomic quartile compared to higher, and children from rural residents compared to urban residents had higher cancer incidence rates and lower five-year survival.
The findings identify multifactorial roots such as structural inequities, limited participation in clinical trials, limited access to health care, delayed diagnosis, inadequate supportive care services, suboptimal treatment access, and restricted access to pediatric oncologists and distance from specialized cancer clinics. Those are contributing factors to poorer survival outcomes. We suggest providing access to healthcare, family support systems, quality treatment, and special support for children from low-income backgrounds, addressing psychological barriers, improving trial enrollment for adolescents, promoting equitable access to resources, and enhancing culturally sensitive support services for all children with cancer. The recommendations could be implemented and practiced to minimize the gaps among demographic, socioeconomic, and resident location strata.
Further studies are still in demand to explore the potential influence of other factors on pediatric cancer survival disparities, leverage granular and patient-level SES data, explore intervention targets, and advocate for policy strategies ensuring equitable, timely cancer care delivery.
7. Conflict of Interest
The author states that there is no conflict of interest.
8. Acknowledgment
The authors would like to acknowledge the NCI and SEER registries for providing access to high-quality, population-based cancer incidence and survival data. The corresponding author acknowledges the support of Dr. Zerai Hagos and Professor Laurent Cleenewerck for their invaluable guidance and comprehensive review of the research paper during the preparation of the dissertation process from which this article was published.
9. Data Availability Statement
The datasets used in this study were obtained from a freely available dataset that does not identify individual participants. A data use request was made for this research purpose, and permission was granted. The dataset is available from the SEER (Surveillance, Epidemiology, and End Results) registry: https://seer.cancer.gov/.
10. Abbreviations
AIC: Akaike Information Criterion; BIC: Bayesian Information Criterion; CI: Confidence Interval; HR: Hazard Ratio; LMICs: Low- and Middle-Income Countries; MICE: Multiple Imputation by Chained Equations; NHB: Non-Hispanic Black; PH: Proportional Hazard; Q: Quartile; SEER: Surveillance, Epidemiology, and End Results; SES: Socioeconomic Status; US: United States; VIFs: Variance Inflation Factors
References
Alcaraz, K. I., Wiedt, T. L., Daniels, E. C., Yabroff, K. R., Guerra, C. E., & Wender, R. C. “Understanding and addressing social determinants to advance cancer health equity in the United States: a blueprint for practice, research, and policy.” CA: a cancer journal for clinicians 70, no. 1(2020): 31-46.
American Cancer Society. Childhood Cancer. 2023. Retrieved: https://www.cancer.org/cancer/cancer-in-children.html.
American Cancer Society. “Cancer in children & adolescents.” Spec Sect Cancer Child Adolesc, 1(ICCC), (2014): 25-42.
Angier, H., Ezekiel-Herrera, D., Marino, M., Hoopes, M., Jacobs, E. A., DeVoe, J. E., & Huguet, N. “Racial/ethnic disparities in health insurance and differences in visit type for a population of patients with diabetes after Medicaid expansion.” Journal of health care for the poor and underserved 30, no.1 (2019): 116-130.
Aristizabal, P., Winestone, L. E., Umaretiya, P., & Bona, K. “Disparities in pediatric oncology: the 21st century opportunity to improve outcomes for children and adolescents with cancer.” In the American Society of Clinical Oncology Educational Book. American Society of Clinical Oncology. Annual Meeting 41, (2021): p. e315.
Baade, P. D., Youlden, D. R., Valery, P. C., Hassall, T., Ward, L., & Green, A. C. “Geographic differences in pediatric cancer outcomes: Evidence from SEER data.” Cancer Epidemiology 54, 2018: 120–126. https://doi.org/10.1016/j.canep.2018.03.003.
Bhatia, S. “Disparities in cancer outcomes: lessons learned from children with cancer.” Pediatric blood & cancer 56, no. 6 (2011): 994-1002.
Bhatia, S., & Landier, W. “Evaluating survivors of pediatric cancer.” The Cancer Journal, 11, no. 4 (2005): 340-354.
Bona, K., Dussel, V., Orellana, L., Kang, T., Geyer, R., Feudtner, C., & Wolfe, J. “Economic impact of advanced pediatric cancer on families.” Journal of pain and symptom management, 47, no. 3 (2014): 594-603.
Bona, K., London, W. B., Guo, D., Abel, G., Lehmann, L., & Wolfe, J. “Prevalence and impact of financial hardship among New England pediatric stem cell transplantation families.” Biology of Blood and Marrow Transplantation 21, no. 2 (2015): 312-318.
Bradley, C. J., Given, C. W., & Roberts, C. Race, “socioeconomic status, and breast cancer treatment and survival.” Journal of the National Cancer Institute 94, no.7 (2002): 490-496.
Chavan, P. P., & Holmes Jr, L. “Pediatric Cancer Incidence, Temporal Trends, and Mortality in the United States by Health Disparities Indicators, SEER (1973–2014).” Cancers 17, no. 17 (2025): 2848.
Gupta, S., Howard, S. C., Hunger, S. P., Antillon, F. G., Metzger, M. L., Israels, T., … & Rodriguez-Galindo, C. “Treating childhood cancer in low-and middle-income countries.” In: Cancer: Disease Control Priorities. 2016; 3(3). The International Bank for Reconstruction and Development / The World Bank, Washington (DC); 2015.
Hendricks, M., Cois, A., Geel, J., Van Heerden, J., Dandara, C., Mohamed, K., … & Kruger, M. “Socioeconomic status significantly impacts childhood cancer survival in South Africa.” Pediatric blood & cancer 70, no. 12 (2023): e30669.
Hunger, S. P., & Mullighan, C. G. “Acute lymphoblastic leukemia in children.” New England Journal of Medicine 373, no.16 (2015): 1541-1552.
Howard, S. C., Baker, J. N., Shulman, R. E., Pui, C. H., & Hunger, S. P. “The global burden of childhood cancer.” Annals of the New York Academy of Sciences 1145, no. 1 (2008): 1–18. https://doi.org/10.1196/annals.1416.001.
Hymel, E., Li, H., Cochran, G. L., Ratnapradipa, K. L., Napit, K., Kabayundo, J., … & Watanabe-Galloway, S. “Rurality and pediatric cancer survival in the United States: An analysis of SEER data from 2000 to 2021.” Cancer Epidemiology 94, 2025: 102705.
Kadan-Lottick, N. S., Ness, K. K., Bhatia, S., & Gurney, J. G. “Survival variability by race and ethnicity in childhood acute lymphoblastic leukemia.” Jama 290, no.15 (2003): 2008-2014.
Keegan, T. H., Parsons, H. M., Chen, Y., Maguire, F. B., Morris, C. R., Parikh-Patel, A., … & Wun, T. “Impact of health insurance on stage at cancer diagnosis among adolescents and young adults.” JNCI: Journal of the National Cancer Institute 111, no. 11 (2019): 1152-1160.
Kehm, R. D., Spector, L. G., Poynter, J. N., Vock, D. M., Altekruse, S. F., & Osypuk, T. L. “Does socioeconomic status account for racial and ethnic disparities in childhood cancer survival?” Cancer 124, no. 20 (2018): 4090-4097.
Klosky, J. L., Tyc, V. L., Srivastava, D. K., Mulrooney, D. A., Hudson, M. M., Brinkman, T. M., … Robison, L. L. “Insurance type and survival outcomes in pediatric cancer patients.” Pediatric Blood & Cancer 67, no. 8 (2020): e28459. https://doi.org/10.1002/pbc.28459.
Kushi, L. H., Byers, T., Doyle, C., Bandera, E. V., McCullough, M., Gansler, T., … & Thun, M. J. “American Cancer Society Guidelines on Nutrition and Physical Activity for cancer prevention: reducing the risk of cancer with healthy food choices and physical activity.” CA: a cancer journal for clinicians 56, no.5 (2006): 254-281.
Kratzer, T. B., Jemal, A., Miller, K. D., Nash, S., Wiggins, C., Redwood, D., … & Siegel, R. L. “Cancer statistics for American Indian and Alaska Native individuals, 2022: Including increasing disparities in early onset colorectal cancer.” CA: A Cancer Journal for Clinicians 73, no. 2 (2023): 120-146.
Linabery, A. M., & Ross, J. A. “Childhood and adolescent cancer survival in the US by race and ethnicity for the diagnostic period 1975‐1999.” Cancer 113, no. 9 (2008): 2575-2596.
Liu, L., Moke, D. J., Tsai, K. Y., Hwang, A., Freyer, D. R., Hamilton, A. S., … & Deapen, D. “A reappraisal of sex-specific cancer survival trends among adolescents and young adults in the United States.” JNCI: Journal of the National Cancer Institute 111, no. 5 (2019): 509-518.
Luo, J., Pollock, B. H., Feusner, J. H., Ribeiro, R. C., & Rubnitz, J. E. “Socioeconomic status as a predictor of survival in childhood acute lymphoblastic leukemia.” Pediatric Blood & Cancer 54, no. 1 (2010): 72–76. https://doi.org/10.1002/pbc.22236.
Miller, K. D., Fidler‐Benaoudia, M., Keegan, T. H., Hipp, H. S., Jemal, A., & Siegel, R. L. “Cancer statistics for adolescents and young adults, 2020.” CA: a cancer journal for clinicians 70, no. 6 (2020): 443-459.
National Cancer Institute. Surveillance, Epidemiology, and End Result Program. Cancer Disparities-Cancer Stat Facts. https://seer.cancer.gov/statfacts. (Accessed April 8, 2025.)
NIH. National Cancer Institute. Cancer Types. Childhood cancers: Cancer in Children and Adolescents. https://www.cancer.gov/types/childhood-cancers/child-adolescent-cancers-fact-sheet. (Accessed August 25, 2025.)
Parsons, H. M., Harlan, L. C., Seibel, N. L., Stevens, J. L., & Keegan, T. H. “Clinical trial participation and time to treatment among adolescents and young adults with cancer: does age at diagnosis or insurance make a difference?” Journal of clinical oncology 29, no. 30 (2011): 4045-4053.
Pui, C. H., Carroll, W. L., Meshinchi, S., & Arceci, R. J. “Biology, risk stratification, and therapy of pediatric acute leukemias: an update.” Journal of clinical oncology 29, no. 5(2011): 551-565.
Pui, C. H., Mullighan, C. G., Evans, W. E., & Relling, M. V. “Pediatric acute lymphoblastic leukemia: where are we going and how do we get there?” Blood, The Journal of the American Society of Hematology 120, no. 6 (2012): 1165-1174.
Salsman, J. M., Bingen, K., Barr, R. D., & Freyer, D. R. “Understanding, measuring, and addressing the financial impact of cancer on adolescents and young adults.” Pediatric blood & cancer 66, no.7 (2019): e27660.
Siegel, R. L., Giaquinto, A. N., & Jemal, A. “Cancer statistics, 2024.” CA: a cancer journal for clinicians, 74, no. 1 (2024): 12-49.
Singh, G. K., & Siahpush, M. “Widening rural–urban disparities in all-cause mortality and mortality from major causes of death in the USA, 1969–2009.” Journal of urban health 92, no. 2 (2014): 272-292.
Smith, M. A., Seibel, N. L., Altekruse, S. F., Ries, L. A., Melbert, D. L., O’Leary, M., … & Reaman, G. H. “Outcomes for children and adolescents with cancer: challenges for the twenty-first century.” Journal of clinical oncology 28, no.15 (2010): 2625-2634.
Spector, L. G., Pankratz, N., & Marcotte, E. L. “Genetic and nongenetic risk factors for childhood cancer.” Pediatric Clinics of North America 62, no. 1 (2014): 11.
Steliarova-Foucher, E., Colombet, M., Ries, L. A., Moreno, F., Dolya, A., Bray, F., … & Tretarre, B. “International incidence of childhood cancer, 2001–10: a population-based registry study.” The lancet oncology 18, no. 6 (2017): 719-731.
Sultan, I., Alfaar, A. S., Sultan, Y., Salman, Z., & Qaddoumi, I. “Trends in childhood cancer: Incidence and survival analysis over 45 years of SEER data.” PLoS One, 20, no. 1 (2025): e0314592.
Surveillance Research Program, National Cancer Institute SEER*Stat software. www.seer.cancer.gov/ seerstat. version 8.4.2. (Accessed February 8, 2025.)
Surveillance, Epidemiology, and End Results (SEER) Program (www.seer.cancer.gov) SEER*Stat Database: Incidence – SEER Research Data, 17 Registries, Nov 2023 Sub (2000-2021) – Linked To County Attributes – Time Dependent (1990-2022) Income/Rurality, 1969-2022 Counties, National Cancer Institute, DCCPS, Surveillance Research Program, released April 2024, based on the November 2023 submission.
The Lancet. The Lancet Oncology/The Lancet Cancer Campaign. https://www.thelancet.com/campaigns/cancer/paediatric-cancer? (Accessed May 30, 2025.)
The Lancet Oncology. Sustainable Care for children with cancer. https://www.thelancet.com/commissions-do/childhood-cancer. (Accessed May 30, 2025.)
Tosakoon, S., Lawrence, W. R., Shiels, M. S., & Jackson, S. S. “Sex differences in cancer incidence rates by race and ethnicity: results from the surveillance, epidemiology, and end results (SEER) registry (2000–2019).” Cancers 16, no.5 (2024): 989.
Ward, E., DeSantis, C., Robbins, A., Kohler, B., & Jemal, A. “Childhood and adolescent cancer statistics, 2014.” CA: a cancer journal for clinicians, 64, no.2 (2014): 83-103.
Williams, D. R., & Mohammed, S. A. “Racism and health I: Pathways and scientific evidence.” American behavioral scientist 57, no.8 (2013): 1152-1173.
Williams, L. A., & Spector, L. G. “Survival differences between males and females diagnosed with childhood cancer.” JNCI cancer spectrum 3, no. 2(2019): pkz032.
[1] Rebecca L Siegel, Giaquinto, A. N., & Jemal, A., “Cancer statistics, 2024,” CA: a cancer journal for clinicians 74, no. 1 (2024): 12-49.
[2] Elizabeth Ward, DeSantis, C., Robbins, A., Kohler, B., & Jemal, A., “Childhood and adolescent cancer statistics,” CA: a cancer journal for clinicians 64, no. 2 (2014): 83-103.
[3] Iyad Sultan, Alfaar, A. S., Sultan, Y., Salman, Z., & Qaddoumi, I., “Trends in childhood cancer: Incidence and survival analysis over 45 years of SEER data,” PLoS One 20, no. 1 (2025), e0314592.
[4] Rebecca L Siegel, Giaquinto, A. N., & Jemal, A., “Cancer statistics, 2024,” CA: a cancer journal for clinicians 74, no. 1 (2024): 12-49.
[5] Smita Bhatia, “Disparities in cancer outcomes: lessons learned from children with cancer,” Pediatric blood & cancer 56, no. 6 (2011): 994-1002.
[6] Paula Aristizabal, Winestone, L. E., Umaretiya, P., & Bona, K., “Disparities in pediatric oncology: the 21st century opportunity to improve outcomes for children and adolescents with cancer,” Annual Meeting 41 (In American Society of Clinical Oncology Educational Book. American Society of Clinical Oncology, 2021): p. e315.
[7] Rebecca D. Kehm, Spector, L. G., Poynter, J. N., Vock, D. M., Altekruse, S. F., & Osypuk, T. L., “Does socioeconomic status account for racial and ethnic disparities in childhood cancer survival?,” Cancer 124, no. 20 (2018): 4090-4097.
[8] Stephen P. Hunger, & Mullighan, C. G., “Acute lymphoblastic leukemia in children,” New England Journal of Medicine 373, no. 16 (2015): 1541-1552.
[9] Malcolm A. Smith, Seibel, N. L., Altekruse, S. F., Ries, L. A., Melbert, D. L., O’Leary, M., … & Reaman, G. H., “Outcomes for children and adolescents with cancer: challenges for the twenty-first century,” Journal of Clinical Oncology 28, no. 15 (2010): 2625-2634.
[10] Nina S. Kadan-Lottick, Ness, K. K., Bhatia, S., & Gurney, J. G., “Survival variability by race and ethnicity in childhood acute lymphoblastic leukemia,” Jama 290, no.15 (2003): 2008-2014.
[11] Amy M. Linabery, & Ross, J. A., “Childhood and adolescent cancer survival in the US by race and ethnicity for the diagnostic period 1975‐1999,” Cancer 113, no. 9 (2008): 2575-2596.
[12] Iyad Sultan, Alfaar, A. S., Sultan, Y., Salman, Z., & Qaddoumi, I., “Trends in childhood cancer: Incidence and survival analysis over 45 years of SEER data,” PLoS One 20, no. 1 (2025): e0314592.
[13] Smita Bhatia, “Disparities in cancer outcomes: lessons learned from children with cancer,” Pediatric blood & cancer 56, no. 6 (2011): 994-1002.
[14] Ching-Hon Pui, Carroll, W. L., Meshinchi, S., & Arceci, R. J., “Biology, risk stratification, and therapy of pediatric acute leukemias: an update,” Journal of clinical oncology 29, no. 5 (2011): 551-565.
[15] Smita Bhatia, & Landier, W., “Evaluating survivors of pediatric cancer,” The Cancer Journal 11, no. 4 (2005): 340-354.
[16] Helen M. Parsons, Harlan, L. C., Seibel, N. L., Stevens, J. L., & Keegan, T. H., “Clinical trial participation and time to treatment among adolescents and young adults with cancer: does age at diagnosis or insurance make a difference?,” Journal of Clinical Oncology 29, no.30 (2011): 4045-4053.
[17] Sumit Gupta, Howard, S. C., Hunger, S. P., Antillon, F. G., Metzger, M. L., Israels, T., … & Rodriguez-Galindo, C., “Treating childhood cancer in low-and middle-income countries,” In: Cancer: Disease Control Priorities 3, no. 3 (2016. The International Bank for Reconstruction and Development/The World Bank, Washington (DC); 2015.
[18] Kira Bona, Dussel, V., Orellana, L., Kang, T., Geyer, R., Feudtner, C., & Wolfe, J., “Economic impact of advanced pediatric cancer on families,” Journal of pain and symptom management 17, no. 3 (2014): 594-603.
[19] Kira Bona, London, W. B., Guo, D., Abel, G., Lehmann, L., & Wolfe, J., “Prevalence and impact of financial hardship among New England pediatric stem cell transplantation families,” Biology of Blood and Marrow Transplantation 21, no. 2 (2015): 312-318.
[20] Lawrence H. Kushi, Byers, T., Doyle, C., Bandera, E. V., et al., “American Cancer Society Guidelines on Nutrition and Physical Activity for cancer prevention: reducing the risk of cancer with healthy food choices and physical activity,” CA: a cancer journal for clinicians 56, no. 5 (2006): 254-281.
[21] Theresa HM Keegan, et al., “Impact of health insurance on stage at cancer diagnosis among adolescents and young adults,” JNCI: Journal of the National Cancer Institute 111, no. 11(2019): 1152-1160.
[22] The Lancet, “The Lancet Oncology/The Lancet Cancer Campaign,” Accessed May 30, 2025. https://www.thelancet.com/campaigns/cancer/paediatric-cancer.
[23] The Lancet Oncology, “Sustainable Care for children with cancer,” Accessed May 30, 2025, https://www.thelancet.com/commissions-do/childhood-cancer.
[24] Logan G Spector, Pankratz, N., & Marcotte, E. L., “Genetic and nongenetic risk factors for childhood cancer,” Pediatric Clinics of North America 62, no. 1 (2014): 11.
[25] John M Salsman, Bingen, K., Barr, R. D., & Freyer, D. R., “Understanding, measuring, and addressing the financial impact of cancer on adolescents and young adults,” Pediatric blood & cancer 66, no. 7 (2019): e27660.
[26] Eva Steliarova-Foucher, Colombet, M., Ries, L. A., et al., “International incidence of childhood cancer, 2001–10: a population-based registry study,” The lancet oncology 18, no.6 (2017): 719-731.
[27] David R. Williams, & Mohammed, S. A., “Racism and health I: Pathways and scientific evidence,” American behavioral scientist 57, no. 8 (2013): 1152-1173.
[28] Heather Angier, Ezekiel-Herrera, D., Marino, M., Hoopes, M., Jacobs, E. A., DeVoe, J. E., & Huguet, N., “Racial/ethnic disparities in health insurance and differences in visit type for a population of patients with diabetes after Medicaid expansion,” Journal of health care for the poor and underserved 30, no. 1(2019): 116-130.
[29] American Cancer Society, “Childhood Cancer. 2023,” Retrieved from https://www.cancer.org/cancer/cancer-in-children.html.
[30] Surveillance Research Program, National Cancer Institute, “SEER*Stat software,” Version 8.4.2, Accessed February 8, 2025, www.seer.cancer.gov/seerstat.
[31] Surveillance, Epidemiology, and End Results (SEER) Program (www.seer.cancer.gov) SEER*Stat Database: Incidence – SEER Research Data, 17 Registries, Nov 2023 Sub (2000-2021) – Linked To County Attributes – Time Dependent (1990-2022) Income/Rurality, 1969-2022 Counties, National Cancer Institute, DCCPS, Surveillance Research Program, released April 2024, based on the November 2023 submission.
[32] American Cancer Society. “Cancer in children & adolescents,” Spec Sect Cancer Child Adolesc 1, ICCC (2014): 25-42.
[33] Lihua Liu, Moke, D. J., Tsai, K. Y., Hwang, A., Freyer, D. R., Hamilton, A. S., … & Deapen, D., “A reappraisal of sex-specific cancer survival trends among adolescents and young adults in the United States,” JNCI: Journal of the National Cancer Institute 111, no. 5 (2019): 509-518.
[34] Sararat Tosakoon, Lawrence, W. R., Shiels, M. S., & Jackson, S. S., “Sex differences in cancer incidence rates by race and ethnicity: results from the Surveillance, Epidemiology, and End Results (SEER) registry (2000–2019),” Cancers 16, no. 5 (2024): 989.
[35] Lindsay A Williams, & Spector, L. G., “Survival differences between males and females diagnosed with childhood cancer,” JNCI cancer spectrum 3, no. 2 (2019): pkz032.
[36] NIH. National Cancer Institute, “Cancer Types. Childhood cancers: Cancer in Children and Adolescents,” Accessed August 25, 2025, https://www.cancer.gov/types/childhood-cancers/child-adolescent-cancers-fact-sheet.
[37] Rebecca D. Kehm, Spector, L. G., Poynter, J. N., Vock, D. M., Altekruse, S. F., & Osypuk, T. L., “Does socioeconomic status account for racial and ethnic disparities in childhood cancer survival?,” Cancer 124, no. 20 (2018): 4090-4097.
[38] Nina S Kadan-Lottick, Ness, K. K., Bhatia, S., & Gurney, J. G., “Survival variability by race and ethnicity in childhood acute lymphoblastic leukemia,” Jama 290, no.15 (2003): 2008-2014.
[39] Sumit Gupta, Howard, S. C., Hunger, S. P., Antillon, F. G., Metzger, M. L., Israels, T., … & Rodriguez-Galindo, C., “Treating childhood cancer in low-and middle-income countries,” In: Cancer: Disease Control Priorities 3, no. 3 (2016). The International Bank for Reconstruction and Development / The World Bank, Washington (DC); 2015.
[40] National Cancer Institute. Surveillance, Epidemiology, and End Results Program, “Cancer Disparities-Cancer Stat Facts,” accessed April 8, 2025, https://seer.cancer.gov/statfacts.
[41] Tyler B Kratzer, Jemal, A., Miller, K. D., Nash, S., Wiggins, C., Redwood, D., … & Siegel, R. L., “Cancer statistics for A merican I ndian and A laska N ative individuals, 2022: Including increasing disparities in early onset colorectal cancer,” CA: A Cancer Journal for Clinicians 73, no. 2 (2023): 120-146.
[42] Smita Bhatia, “Disparities in cancer outcomes: lessons learned from children with cancer,” Pediatric blood & cancer 56, no. 6 (2011): 994-1002.
[43] Ching-Hon Pui, Mullighan, C. G., Evans, W. E., & Relling, M. V., “Pediatric acute lymphoblastic leukemia: where are we going and how do we get there?,” Blood, The Journal of the American Society of Hematology 120, no. 6 (2012): 1165-1174.
[44] Emma Hymel, Li, H., Cochran, G. L., Ratnapradipa, K. L., Napit, K., Kabayundo, J., … & Watanabe-Galloway, S., “Rurality and pediatric cancer survival in the United States: An analysis of SEER data from 2000 to 2021,” Cancer Epidemiology 94, 2025: 102705.
[45] Marc Hendricks, Cois, A., Geel, J., Van Heerden, J., Dandara, C., Mohamed, K., … & Kruger, M., “Socioeconomic status significantly impacts childhood cancer survival in South Africa,” Pediatric blood & cancer 70, no. 12 (2023): e30669.
[46] Howard S. C., Baker, J. N., Shulman, R. E., Pui, C. H., & Hunger, S. P., “The global burden of childhood cancer,” Annals of the New York Academy of Sciences 1145, no. 1 (2008): 1–18. https://doi.org/10.1196/annals.1416.001.
[47] Bradley, C. J., Given, C. W., & Roberts, C. Race, “Socioeconomic status, and breast cancer treatment and survival,” Journal of the National Cancer Institute 94, no.7 (2002): 490-496.
[48] Smita Bhatia, “Disparities in cancer outcomes: lessons learned from children with cancer,” Pediatric blood & cancer 56, no. 6 (2011): 994-1002.
[49]Ching-Hon Pui, Mullighan, C. G., Evans, W. E., & Relling, M. V., “Pediatric acute lymphoblastic leukemia: where are we going and how do we get there?,” Blood, The Journal of the American Society of Hematology 120, no. 6 (2012): 1165-1174.
[50] Klosky J. L., Tyc, V. L., Srivastava, D. K., Mulrooney, D. A., Hudson, M. M., Brinkman, T. M., … Robison, L. L., “Insurance type and survival outcomes in pediatric cancer patients,” Pediatric Blood & Cancer 67, no. 8 (2020): e28459. https://doi.org/10.1002/pbc.28459.
[51] Helen M Parsons, Harlan, L. C., Seibel, N. L., Stevens, J. L., & Keegan, T. H., “Clinical trial participation and time to treatment among adolescents and young adults with cancer: does age at diagnosis or insurance make a difference?,” Journal of clinical oncology 29, no. 30 (2011): 4045-4053.
[52] Sumit Gupta, Howard, S. C., Hunger, S. P., Antillon, F. G., Metzger, M. L., Israels, T., … & Rodriguez-Galindo, C., “Treating childhood cancer in low-and middle-income countries,” In: Cancer: Disease Control Priorities. 2016; 3(3).
[53] Prachi P Chavan, & Holmes Jr, L., “Pediatric Cancer Incidence, Temporal Trends, and Mortality in the United States by Health Disparities Indicators, SEER (1973–2014),” Cancers 17, no. 17 (2025): 2848.
[54] Emma Hymel, Li, H., Cochran, G. L., Ratnapradipa, K. L., Napit, K., Kabayundo, J., … & Watanabe-Galloway, S., “Rurality and pediatric cancer survival in the United States: An analysis of SEER data from 2000 to 2021,” Cancer Epidemiology 94, 2025: 102705.
[55] Gobal K Singh, & Siahpush, M., “Widening rural–urban disparities in all-cause mortality and mortality from major causes of death in the USA, 1969–2009,” Journal of urban health 92, no. 2 (2014): 272-292.
[56] Baade P. D., Youlden, D. R., Valery, P. C., Hassall, T., Ward, L., & Green, A. C., “Geographic differences in pediatric cancer outcomes: Evidence from SEER data,” Cancer Epidemiology 54, 2018: 120–126. https://doi.org/10.1016/j.canep.2018.03.003.
[57] Emma Hymel, Li, H., Cochran, G. L., Ratnapradipa, K. L., Napit, K., Kabayundo, J., … & Watanabe-Galloway, S., “Rurality and pediatric cancer survival in the United States: An analysis of SEER data from 2000 to 2021,” Cancer Epidemiology 94, 2025: 102705.
[58] Logan G Spector, Pankratz, N., & Marcotte, E. L., “Genetic and nongenetic risk factors for childhood cancer,” Pediatric Clinics of North America 62, no. 1 (2014): 11.
[59] Luo J., Pollock, B. H., Feusner, J. H., Ribeiro, R. C., & Rubnitz, J. E., “Socioeconomic status as a predictor of survival in childhood acute lymphoblastic leukemia,” Pediatric Blood & Cancer 54, no. 1 (2010): 72–76. https://doi.org/10.1002/pbc.22236.
[60] John M Salsman, Bingen, K., Barr, R. D., & Freyer, D. R., “Understanding, measuring, and addressing the financial impact of cancer on adolescents and young adults,” Pediatric blood & cancer 66, no.7 (2019): e27660.
[61] Eva Steliarova-Foucher, Colombet, M., Ries, L. A., Moreno, F., Dolya, A., Bray, F., … & Tretarre, B., “International incidence of childhood cancer, 2001–10: a population-based registry study,” The lancet oncology 18, no. 6 (2017): 719-731.
[62] David R Williams, & Mohammed, S. A., “Racism and health I: Pathways and scientific evidence,” American behavioral scientist 57, no.8 (2013): 1152-1173.