Abstract:
Malaria remains a persistent public health challenge in Ethiopia, with urban highland areas like Addis Ababa increasingly at risk due to climate change, population mobility, and health system gaps. Despite national progress toward elimination, facility-level preparedness in these regions is underexplored.
This study assessed the diagnostic and treatment readiness of 466 health facilities in Addis Ababa using the WHO Service Availability and Readiness Assessment (SARA) framework. Data were collected through structured questionnaires and checklists assessing infrastructure, workforce, commodity availability, and governance. Facilities scoring ≥70% across 75 malaria-specific indicators were classified as “ready.” Multivariate logistic regression identified key predictors of readiness.
Only 41.6% of facilities met the general readiness threshold. Diagnostic readiness was 69.9%, while 52.6% had adequate medication availability. Significant predictors included government support (AOR = 3.37), financial backing (AOR = 2.31), community awareness (AOR = 2.91), performance reviews (AOR = 5.02), and presence of pharmacists (AOR = 7.2). Stockouts of ACTs and RDTs, limited 24-hour services, and undertrained staff were common, especially in private and outpatient-only facilities.
Overall, malaria diagnostic and treatment readiness in Addis Ababa’s urban highlands remains suboptimal, posing a risk to Ethiopia’s malaria elimination efforts.
- Introduction
Malaria continues to be one of the most pressing public health challenges in Ethiopia, despite significant steps in reducing disease incidence and mortality over recent decades.[1] The country’s vast ecological diversity and climatic variations contribute to the heterogeneous transmission patterns, with urban highland areas, such as Addis Ababa, emerging as new focal zones due to climate change and population shifts.[2] While national interventions such as insecticide-treated nets (ITNs) and indoor residual spraying (IRS) have yielded encouraging outcomes, the risk of malaria resurgence remains high in the absence of resilient health systems and adaptive surveillance strategies.[3]
The Health Sector Transformation Plan (HSTP I) documented a steep reduction in malaria cases, from 5.2 million in 2015 to fewer than 1 million in 2019. Likewise, malaria-related mortality fell from 3.6 to 0.3 deaths per 100,000 at-risk population during the same period, according to the Federal Ministry of Health, Ethiopia.[4] As Ethiopia intensifies efforts toward malaria elimination by 2030, it is crucial to ensure that all districts, especially newly affected highland and fringe transmission zones, are equipped to detect, treat, and prevent malaria. Unfortunately, the Health Sector Transformation Plan does not adequately address the readiness of health facilities to manage malaria cases, particularly in areas newly at risk due to climatic shifts and population movement.
- Literature review
Climate change, land use transformation, and population displacement contribute to malaria transmission in previously unaffected highland regions. Yet, the empirical understanding of how these environmental and socioeconomic factors influence malaria dynamics at the sub-national level is limited. Similarly, little is known about how health systems, particularly at the primary care level, are equipped to handle malaria’s growing and shifting burden. Evidence on the availability of diagnostic tools, treatment protocols, skilled personnel, and stock levels of antimalarial commodities is fragmented or outdated. Moreover, current national strategic documents fall short in addressing the granular, district-level burden of disease and facility preparedness, which are critical for targeted interventions.
The sustainability of Ethiopia’s malaria control achievements hinges not only on the continuity of vector control strategies but also on the capacity of the health system to adapt to emerging threats. This includes detecting new transmission foci, ensuring uninterrupted commodity supply chains, training healthcare workers, and deploying effective surveillance mechanisms. Without a clear understanding of malaria’s prevalence, trends, and determinants, alongside the readiness of health facilities to respond, efforts to achieve elimination may falter. Malaria transmission in highland areas has historically been low due to cooler temperatures and ecological barriers. However, climate change, population movement, and health system inefficiencies have increased malaria cases in these regions. Health facility readiness plays a crucial role in malaria control, yet significant gaps persist, affecting effective case management and prevention. Health facilities in highland areas often experience stockouts of essential malaria commodities, including rapid diagnostic tests (RDTs) and artemisinin-based combination therapies (ACTs).
Studies highlighted that suboptimal intervention coverage and inconsistent supply chains hinder malaria control efforts.[5][6] The availability of essential malaria commodities, including rapid diagnostic tests (RDTs), antimalarial drugs, and trained personnel, is critical in a health facility. Effective malaria case management requires timely diagnosis and appropriate treatment. Higher facility readiness was associated with a reduced risk of severe malaria cases and mortality. Facilities with better infrastructure, staffing, and supervision demonstrated improved malaria case management.[7] A qualitative evaluation of malaria service delivery in 11 Sub-Saharan African countries emphasized the importance of on-site training and supervision to improve provider competency and supply chain management.[8] Many health facilities continue to rely on outdated treatment protocols despite the World Health Organization (WHO) warning that increasing drug resistance is undermining malaria treatment effectiveness. This contradiction highlights the need for regular protocol updates and drug resistance monitoring.[9]
Despite global funding for malaria control, resource allocation remains uneven, with highland areas often receiving less financial support compared to endemic lowland regions. This disparity affects facility readiness and intervention sustainability.
This study addresses this gap by assessing the diagnostic and treatment readiness of 466 health facilities across five sub-cities of Addis Ababa, using WHO’s Service Availability and Readiness Assessment (SARA) indicators. The findings aim to inform targeted policy interventions and reinforce malaria control efforts in climatically vulnerable urban highland contexts by evaluating core components such as laboratory infrastructure, medicine availability, human resources, and governance support.
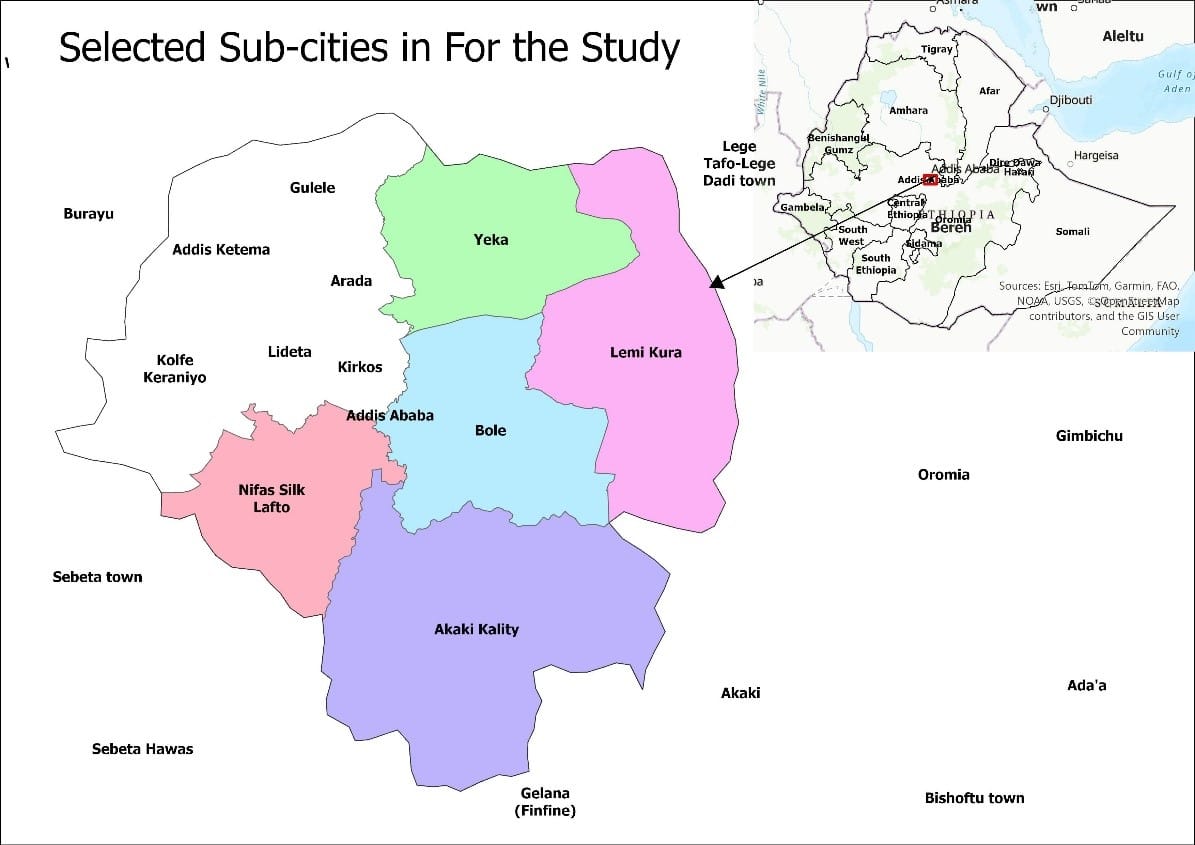
| Figure 1: Selected sub-cities for study of malaria prevalence and climatic, socio-demographic, environmental, ecological, and household determinants. |
3. Methods
3.1 Study Design and Setting
This facility-based cross-sectional assessment was conducted across selected sub-cities of Addis Ababa, Ethiopia’s capital and its principal urban highland center. The city’s unique elevation (~2,355 meters above sea level) and growing vulnerability to climate-driven vector dynamics necessitated targeted evaluation of malaria service readiness. Addis Ababa comprises 11 administrative sub-cities, several of which have recently recorded malaria incidence, indicating a possible expansion of transmission zones.
3.2 Sampling Technique and Sample Size
A cluster random sampling approach was employed to ensure geographic and structural representation across urban health service delivery nodes. Five sub-cities: Akaki Kality, Bole, Yeka, Nifas Silk Lafto, and Lemi Kura were selected as primary clusters.
All health facilities within these sub-cities (N=466) were included, spanning 60 districts and comprising public and private health institutions. This sampling strategy supports robust generalizability and reflects the heterogeneous nature of malaria transmission risk within the urban highland context. See Figure 1, which shows the map of Addis Ababa city and selected subcities.
3.3 Data Collection Instruments and Sources
Readiness was assessed using structured questionnaires derived from the World Health Organization’s Service Availability and Readiness Assessment (SARA) framework, complemented by malaria-specific metrics adapted from regional studies. Quantitative data were triangulated with qualitative inputs from facility observations and stakeholder interviews, including health managers, logistics officers, and clinical personnel. The tools examined institutional capacity across six health system building blocks: infrastructure, workforce, medical commodities, diagnostic equipment, service delivery, and governance structures.
3.4 Variable Definitions and Measurement
The outcome variable general health facility readiness was determined using a 75-item checklist covering malaria diagnosis and treatment components. Facilities scoring ≥70% were categorized as “ready.” Two sub-indices were also constructed: Diagnostic Readiness (7 items), Medication Readiness (12 items). Independent variables included structural attributes (facility type, management), operational inputs (trained personnel, supervision visits, malaria guidelines), and community-level engagement (awareness campaigns, surveillance practices).
2.5 Validity, Reliability, and Statistical Analysis
Instrument reliability was assessed using Cronbach’s Alpha,[10] Yielding coefficients of 0.80 for general readiness and diagnostic/treatment. The subscales indicate strong internal consistency.[11][12] Multicollinearity among predictors was evaluated using the Variance Inflation Factor (VIF), with all values below 3.0 confirming model stability.[13] Descriptive statistics profiled facility characteristics, followed by bivariate and multivariate logistic regression to identify statistically significant predictors of health facility readiness. Confounding control was achieved via adjusted odds ratios (AORs), ensuring independent associations were correctly estimated. All analyses were conducted using SPSS Version 30. Ethical approval was received from Euclid University and the Addis Ababa Health Bureau to conduct this study.
4. Results
The descriptive analysis shows that Lemikura hosts the largest share of health facilities (26.2%, n=122). Clinics dominate the service landscape, comprising 84.5% (n=394) of facilities. Most facilities are privately owned (92.3%), and Government engagement in malaria-related activities was reported by 80.9% (n=377) of facilities. Supervision occurred within the last three months in 52.8% of facilities. In 93.4% of facilities, pharmacy services were assessed, while human resources received the least assessment (6.6%).
National malaria guidelines were observed in 55.4% of facilities, and IPC guidelines were observed in 60.7%. Most facilities had fewer than five inpatient beds (65.0%), relied on the national electricity grid (94.2%), and maintained consistent electricity availability (62.0%). Operating hours were predominantly 9–16 hours per day (79.6%), with only 14.8% providing 24-hour service. Privacy measures were mainly video-only (63.9%), and sanitation infrastructure included flush toilets in 76.2% of facilities. Waste disposal practices relied heavily on open burning for both sharps (79.4%) and non-sharps (79.0%), with limited use of incineration. See Table 1 for more information on infrastructure, governance, and policies.
Table 1: Infrastructure, governance, and policies at health facilities
| Characteristics | Category | Number | Percent(%) |
| Subcity | Akaki Kality | 101 | 21.7 |
| Bole | 73 | 15.7 | |
| Lemikura | 122 | 26.2 | |
| Nifas Silk Lafto | 98 | 21.0 | |
| Yeka | 72 | 15.5 | |
| Health facility type | Clinic | 394 | 84.5 |
| Health Center | 33 | 7.1 | |
| General Hospital | 9 | 1.9 | |
| Specialty Center | 30 | 6.4 | |
| Health facility management | Government/public | 36 | 7.7 |
| Private for-profit | 430 | 92.3 | |
| Government gives
attention |
Yes | 377 | 80.9 |
| No | 89 | 19.1 | |
| Supervision from
higher level |
No supervision | 13 | 2.8 |
| More than 3 months | 93 | 20.0 | |
| In the last 3 months | 246 | 52.8 | |
| This month | 114 | 24.5 | |
| Availability of national
guide |
Yes, observed | 258 | 55.4 |
| Yes, reported not seen | 180 | 38.6 | |
| Not available | 28 | 6.0 | |
| IPC guideline available | Yes observed | 283 | 60.7 |
| Yes, reported not seen | 169 | 36.3 | |
| Not available | 14 | 3.0 | |
| Inpatient beds | Yes | 451 | 96.8 |
| No | 15 | 3.2 | |
| Number of
inpatient beds |
Less than 5 | 303 | 65.0 |
| 6-10 beds | 108 | 23.2 | |
| 11-20 beds | 45 | 9.7 | |
| More than 20 beds | 10 | 2.1 | |
| Source of Electricity | Generator | 27 | 5.8 |
| National Grid | 439 | 94.2 | |
| Electricity in the
last 7 days |
Sometimes (frequent out.) | 22 | 4.7 |
| <2 hours interruption | 155 | 33.3 | |
| Always available | 289 | 62.0 | |
| HF opening hours | 4 hours or less | 9 | 1.9 |
| 9-16 hours | 373 | 80.0 | |
| 17-23 hours | 15 | 3.2 | |
| 24 hours | 69 | 14.8 | |
| Room Privacy | Audio privacy only | 24 | 5.2 |
| Video privacy only | 298 | 63.9 | |
| Both audio and video privacy | 144 | 30.9 | |
| Type of toilet | Pit latrine with slab | 20 | 4.3 |
| Flush toilet | 355 | 76.2 | |
| Waste disposal for sharps | Incinerator | 96 | 20.6 |
| Open burning | 370 | 79.4 | |
| Waste disposal
for non-sharps |
Incinerator | 96 | 20.6 |
| Open burning | 370 | 79.4 |
Human Resources Availability at Health Facilities
The presence of healthcare professionals varies significantly across different categories. Specialist doctors are relatively few, in just 22.5% (105) of health facilities. In contrast, general practitioners are more widely available in 78.8% (367) of health facilities. Paramedical professionals show a near-even distribution in 49.1% (229) of health facilities. Nurses overwhelmingly dominate the workforce, with an impressive presence in 99.4% (463) of facilities. Similarly, pharmacists are highly present and available in 95.9% (447) of facilities. Laboratory technicians also maintain a strong presence in 96.1% (448) of facilities. On the other hand, community health workers are notably scarce, present in only 9.2% (43) of facilities, leaving a substantial 90.8% (423) without these categories.
Service Delivery, Finance, and Health Information
Most facilities demonstrated positive service characteristics, with 70.6% reporting financial support and referral linkages, 65.0% providing regular health education, and 70.0% noting community awareness of malaria. Free diagnosis and treatment for the poor were available in 63.9% of facilities. Performance monitoring was common, with 65.0% tracking report completeness and 68.0% monitoring timeliness, while malaria surveillance was evenly split between active and passive approaches (50.4%).
Infrastructure gaps remain, as only 33.0% had landline telephones, although cellular phones (78.1%), computers (77.9%), and internet access (73.4%) were more prevalent. Functional ambulances were present in 47.4% of facilities, with fuel available in 76.5%. Electricity supply was universal, with 57.1% having secondary sources, while water from direct pipes was available in 97.9% and OPD toilets in 80.9% of facilities.
Regarding malaria service readiness, 66.7% of facilities provided diagnosis and treatment, with 62.7% using RDTs and 57.7% equipped with microscopes. Malaria treatment medications were prescribed in 58.6% of facilities, and prophylaxis was available in 41.6%. Chemistry and hematology machines were present in 56.9% of facilities, whereas blood transfusion services were rare (5.6%), with blood sourced mainly from national stores. Training coverage was low, with only 36.3% of staff trained in malaria diagnosis and 33.0% in malaria treatment. See Table 2 for more information.
Table 2: Finance, health information, and service delivery characteristics
| Characteristic | Yes | No |
| Financial support available | 329(70.6) | 137(29.4) |
| HF provides regular health education | 303(65.0) | 163(35.0) |
| HF has a referral linkage with a higher facility | 329(70.6) | 137(29.4) |
| HF reports that the community is aware of malaria | 326(70.0) | 140(30.0) |
| Provides free diagnosis and treatment for the poor | 298(63.9) | 168(36.1) |
| Analyzes malaria indicators/measures performance | 303(65.0) | 163(35.0) |
| Monitors report completeness and timeliness | 317(68.0) | 149(32.0) |
| Conducts active and passive malaria surveillance | 235(50.4) | 231(49.6) |
| Landline telephone | 154(33.0) | 312(67.0) |
| Cellular telephone | 364(78.1) | 102(21.9) |
| Computer | 363(77.9) | 103(22.1) |
| Internet (email) | 342(73.4) | 124(26.6) |
| Functional ambulance | 221(47.4) | 245(52.6) |
| Fuel for the ambulance | 169(76.5) | 52(23.5) |
| Electricity | 466(100.0) | 0(0.0) |
| Secondary electric source | 266(57.1) | 200(42.9) |
| Get water from a direct pipe | 456(97.9) | 10(2.1) |
| Toilet for OPD attendants | 377(80.9) | 89(19.1) |
| Diagnose and treat malaria | 311(66.7) | 155(33.3) |
| Conduct a diagnosis with RDT | 292(62.7) | 174(37.3) |
| RDT stock out in the last 4 weeks | 73(15.7) | 393(84.3) |
| Light microscope | 269(57.7) | 197(42.3) |
| Glass slide covers lips | 317(68.0) | 149(32.0) |
| Prescribe malaria treatment | 273(58.6) | 193(41.4) |
| Chemistry and Hematology Machines | 265(56.9) | 201(43.1) |
| Trained in malaria diagnosis | 169(36.3) | 297(63.7) |
| Staff trained in Malaria treatment | 154(33.0) | 312(67) |
| Provides prophylaxis for malaria | 194(41.6) | 272(58.4) |
| Conducts blood transfusion | 26(5.6) | 440(94.4) |
| Receives blood from the national store | 17(3.6) | 9(1.9) |
| Conducts blood screening before transfusion | 17(3.6) | 9(1.9) |
| ACT stock out in the last 4 weeks | 79(17.0) | 387(83.0) |
Medical Technologies for Malaria Diagnosis
Sterilization and diagnostic equipment availability across healthcare facilities show a varying degree of presence. Electric autoclaves were available and observed in 55.8% (260) of facilities. Similarly, non-electric autoclaves are present in 56.4% (263). Electric dry heat sterilizers are observed in 55.6% (259) for sterilization via dry heat. Boilers reflect similar availability patterns, with electric and non-electric pot boilers observed in 53.2% (248) of facilities.
Non-electric heat sources show slightly lower availability, observed in 52.1% (243). As for diagnostic capabilities, functional Rapid Diagnostic Tests (RDTs) for malaria are widely available, observed in 58.2% (271) of facilities. See Table 3 for more information on the availability of medical technologies.
Table 3: Availability of Medical Technologies at health facilities
| Characteristics | Yes, observed | Yes, reported, but not seen | Not Available |
| Electric autoclave | 260(55.8) | 191(41.0) | 15(3.2) |
| Non-electric autoclave | 263(56.4) | 190(40.8) | 13(2.8) |
| Electric dry heat sterilizer | 259(55.6) | 192(41.2) | 15(3.2) |
| Electric boiler | 248(53.2) | 203(43.6) | 15(3.2) |
| Non-electric pot boiler | 248(53.2) | 205(44.0) | 13(2.8) |
| Non-electric heat source | 243(52.1) | 207(44.4) | 16(3.4) |
| Functional RDT available | 271(58.2) | 167(35.8) | 28(6.0) |
Malaria Testing Functionality at the Health Facility
Among the health facilities surveyed, 240(51.5%) conduct blood smear tests onsite and 212(45.5%) conduct blood smear tests offsite. 223(47.9%) of the facilities conduct hemoglobin tests onsite and 229(49.1%) conduct hemoglobin tests offsite. 292(62.7%) of health facilities conduct malaria tests using RDT. Seventy-three health facilities reported RDT stockouts in the last month.
Malaria Medication Availability
Among all health facilities visited in the study, ACT (Artemisinin-based Combination Therapy) was available and valid in 55.2% (257) HFs. Meanwhile, 32.8% (153 HFs) reported they did not have ACT during the visit. Oral Artemisinin followed a similar trend, with 55.2% (257 HFs) reported as available and valid. A notable 37.6% (175 HFs) reported absence of the drug during the visit
The results for artesunate injections and rectal formulations showed that availability and validity were 57.5% (268 HFs. However, 34.1% (159 HFs) did not have the drug during the time of visit, and it was never unavailable in 1.3% (6 HFs). SP (Sulfadoxine-Pyrimethamine) was available and valid in 58.4% (272 HFs. The availability of Oral Chloroquine was slightly higher, with 59.2% (276 HFs) available and valid. Quinine (oral or IV) was available and valid in 61.2% (285 HFs. Please see Table 5 for more information. The availability of IV Normal Saline was higher, with 63.5% (296 HFs) reporting as available and valid. The majority, 63.3% (295 HFs), had valid IV Ringer’s Lactate. Dextrose 5% IV showed availability and validity in 61.6% (287 HFs). Analysis of Insecticide Treated Nets (ITNs) availability for patients showed that 62.2% (290 HFs) had valid and available ITNs (Table 4).
Pharmacy technicians are predominantly responsible for medical supplies (85.0%), with nurses, clinical officers, and pharmacists playing lesser roles. Higher-level facilities determine required medical supplies in 98.3% of HFs, and private sources are the main supply channel in 75.3% of HFs, followed by national stores in 23.4% and NGOs/donors in 1.3%. Please see Table 5 for more information.
Table 4: Availability of malaria medication at health facilities
| Medications | Available
and valid |
Reported available but not seen | Available not valid | Not available today | Never available |
| ACT | 257(55.2) | 12(2.6) | 38(8.2) | 153(32.8) | 6(1.3) |
| Oral artemisinin | 257(55.2) | 4(0.9) | 24(5.2) | 175(37.6) | 6(1.3) |
| Artesunate (inj&rec) | 268(57.5) | 6(1.3) | 27(5.8) | 159(34.1) | 6(1.3) |
| SP | 272(58.4) | 10(2.1) | 60(12.9) | 116(24.9) | 8(1.7) |
| Oral chloroquine | 276(59.2) | 8(1.7) | 68(14.6) | 108(23.2) | 6(1.3) |
| Quinine (oral or IV) | 285(61.2) | 6(1.3) | 59(12.7) | 110(23.6) | 6(1.3) |
| Oral primaquine | 283(60.7) | 11(2.4) | 70(15.0) | 96(20.6) | 6(1.3) |
| IV normal saline | 296(63.5) | 4(0.9) | 51(10.9) | 108(23.2) | 7(1.5) |
| IV Ringer’s Lactate | 295(63.3) | 6(1.3) | 55(11.6) | 104(22.3) | 6(1.3) |
| Dextrose 5% IV | 287(61.6) | 5(1.1) | 62(13.3) | 106(22.7) | 6(1.3) |
| ITN for patients | 290(62.2) | 6(1.1) | 56(12.0) | 107(23.0) | 7(1.5) |
Table 5: ACT stockout and medical supply characteristics
| Characteristics | Category | Number | Percent(%) |
| ACT stockout days | More than 14 days | 30 | 38.0 |
| 7-14 days | 36 | 45.6 | |
| Less than 7 days | 13 | 16.4 | |
| Responsible for medical supplies | Nurse | 52 | 11.2 |
| Clinical officer | 8 | 1.7 | |
| Pharmacy technician | 396 | 85.0 | |
| Pharmacist | 10 | 2.1 | |
| Who determines medical supplies | The facility itself | 8 | 1.7 |
| Higher-level facility | 458 | 98.3 | |
| The primary source of medical supplies | Private source | 351 | 75.3 |
| NGO/donors | 6 | 1.3 | |
| National store | 109 | 23.4 |
Diagnostic, Medication, and General Health Facility Readiness
Malaria Diagnostic readiness was measured using seven indicators. Facilities that fulfilled 70% or more were categorized as ready to diagnose malaria. Similarly, medication availability was measured using 12 indicators, and a 70% or above is considered ready. General facility readiness was calculated using 75 indicators described in the methodology. Those health facilities that fulfill 70% of the criteria were categorized as ready to diagnose and treat malaria. Accordingly, 345 (69.9%) of health facilities were found ready to diagnose malaria; 245(52.6%) of health facilities had the required medications to treat malaria, and 194 (41.6%) of health facilities were found to be prepared to provide malaria diagnosis and treatment services or fulfilled the general readiness criteria.
Figure 2 presents a box plot of the readiness score of health facilities by health facility type. Health centers and general hospitals show a higher level of general readiness.
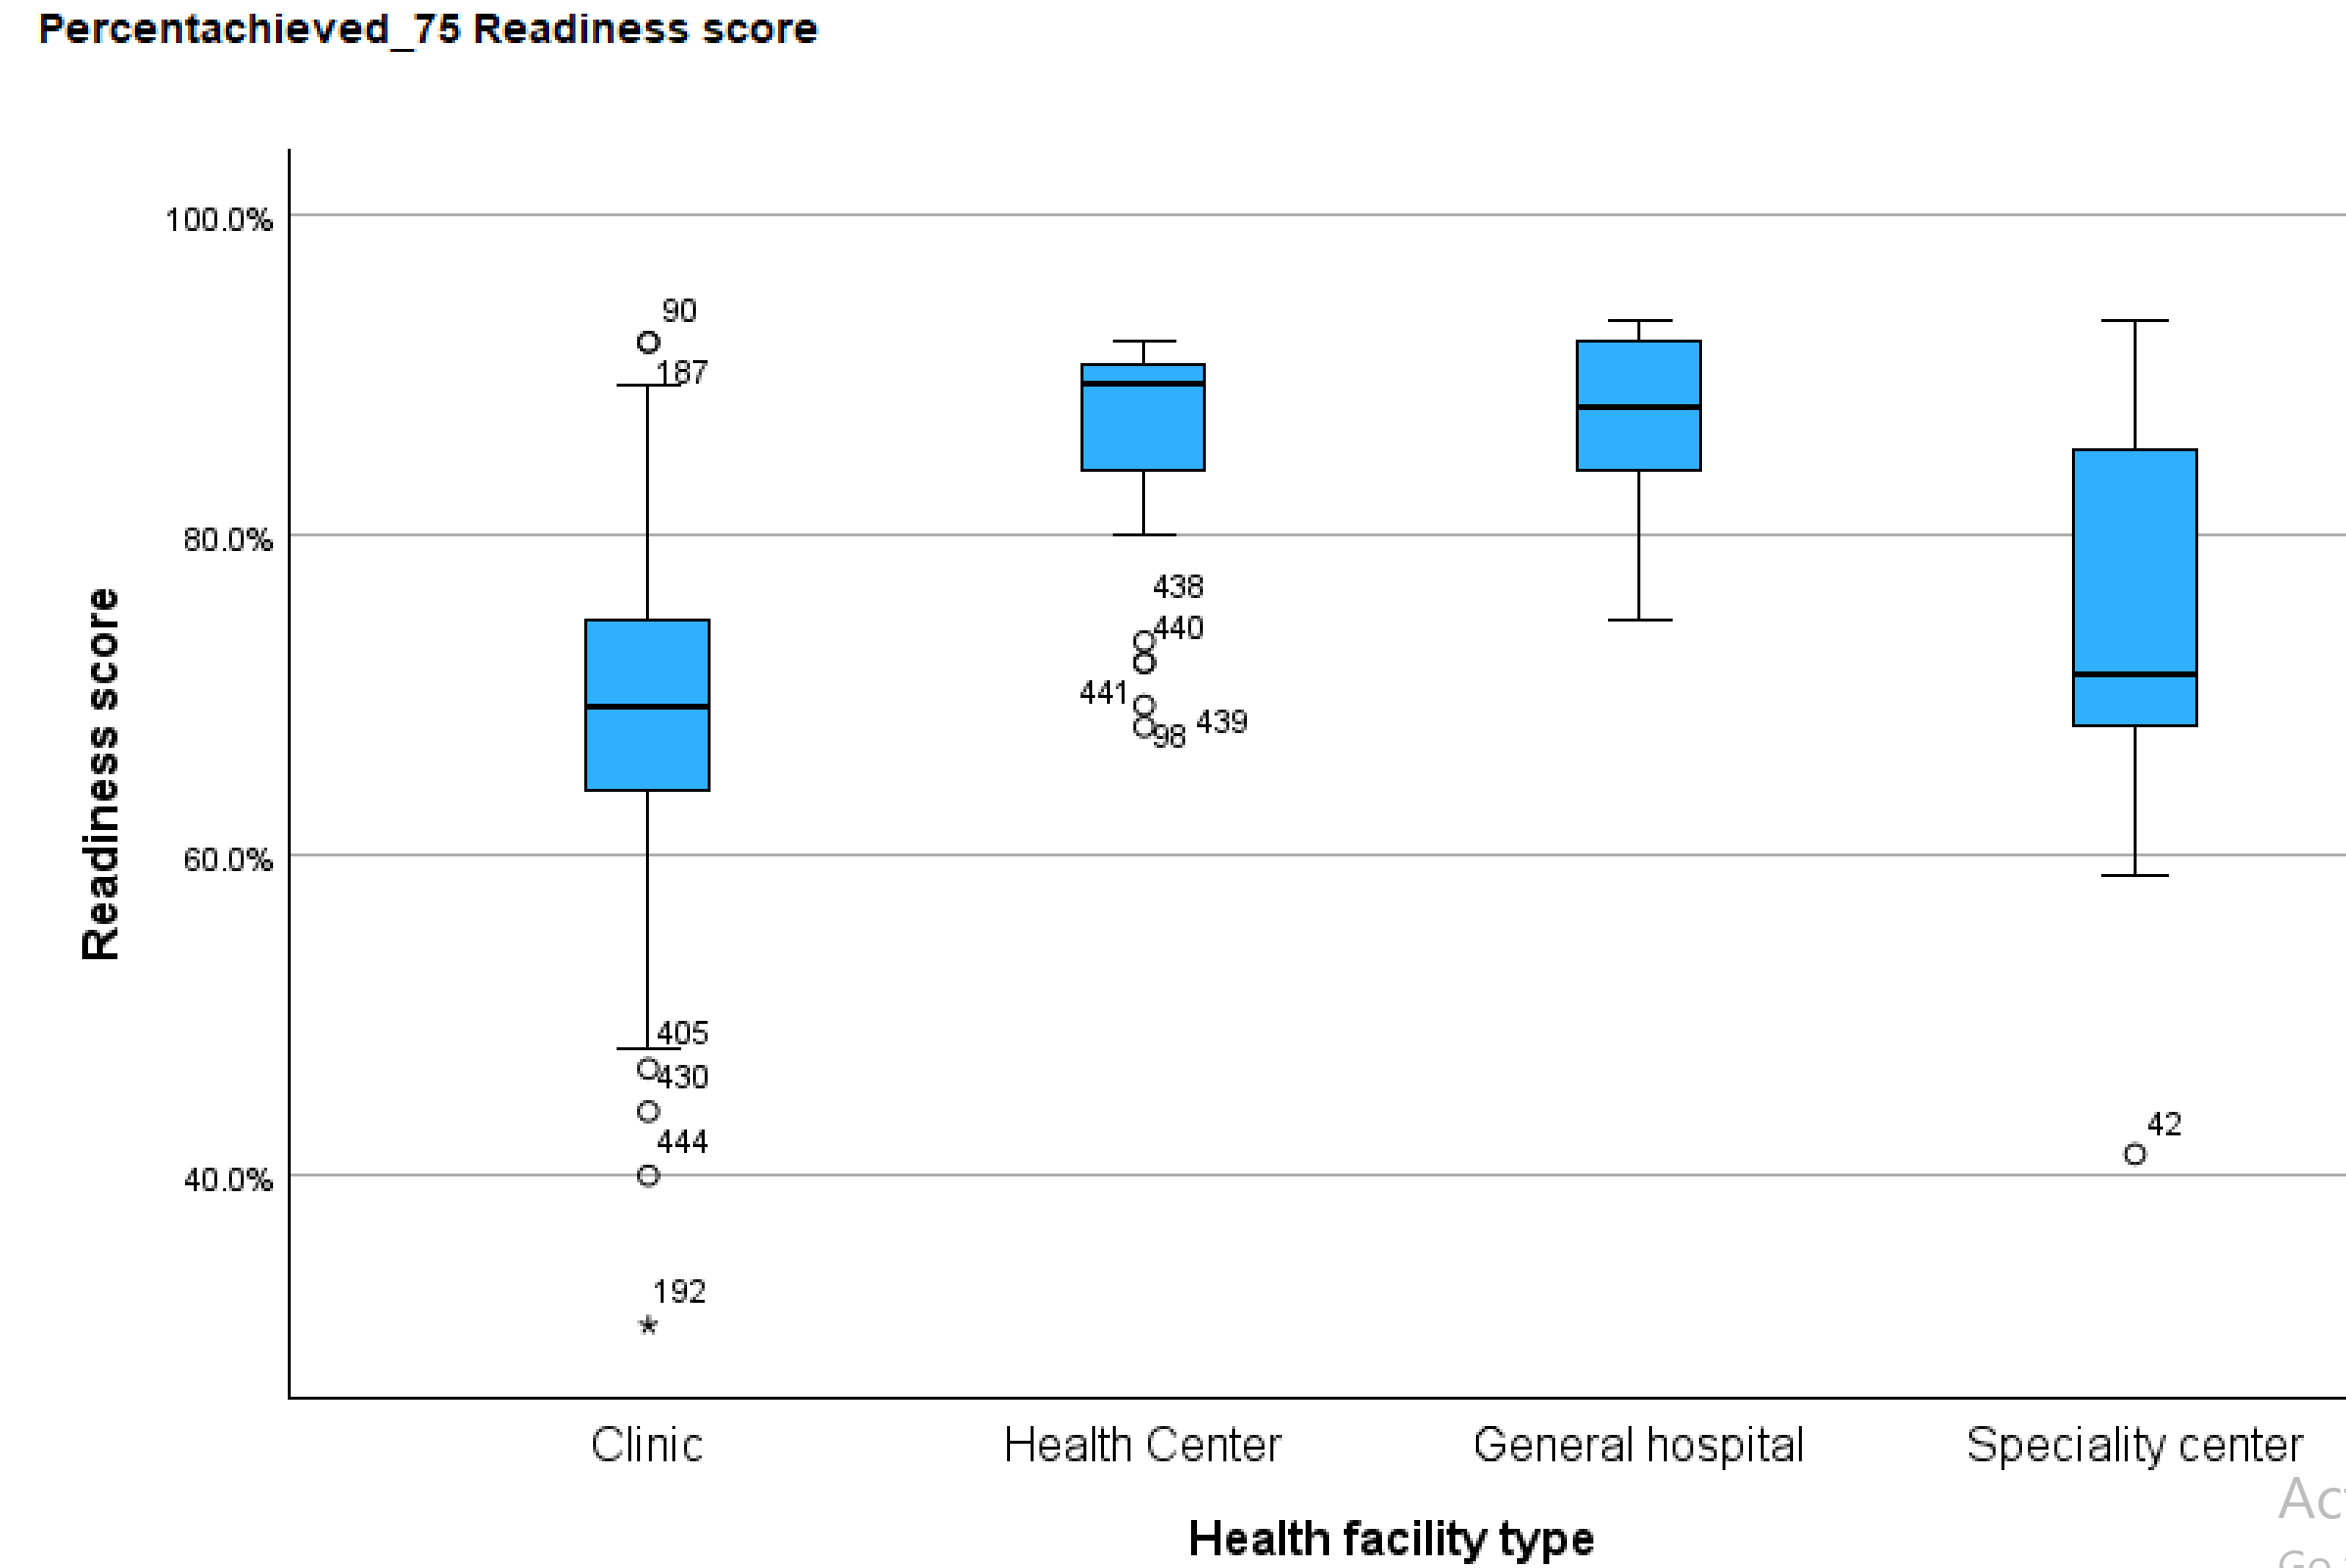
Figure 2: Readiness percentage score of health facilities by health facility category
A logistic regression model assessed the association between health facility readiness and influencing factors. Variance Inflation Factor (VIF) analysis was conducted to evaluate multicollinearity and ensure model stability. The mean VIF for the model is 1.65, indicating acceptable levels of collinearity. Table 6 presents the detailed values of the VIF scores for the fitted variables. All variables have a VIF below three, confirming that multicollinearity does not significantly affect the model.
Table 6: Variance Inflation Factor analysis for health facility readiness factors
| Variable | VIF | SQRT VIF | Tolerance | R-Squared |
| HF management | 1.55 | 1.25 | 0.6449 | 0.3551 |
| HF is outpatient only | 1.37 | 1.17 | 0.7301 | 0.2699 |
| Government gives close attention & follow-up | 1.31 | 1.14 | 0.7642 | 0.2358 |
| Date of last supervision | 1.25 | 1.12 | 0.8008 | 0.1992 |
| Financial support | 1.51 | 1.23 | 0.6626 | 0.3374 |
| The community is aware of Malaria symptoms | 1.6 | 1.27 | 0.6246 | 0.3754 |
| HF conducts performance analysis | 1.85 | 1.36 | 0.5412 | 0.4588 |
| HF conducts active and passive surveillance | 1.54 | 1.24 | 0.6507 | 0.3493 |
| prescribe_treatmentmala | 1.31 | 1.14 | 0.763 | 0.237 |
| Availability of national guidelines | 1.3 | 1.14 | 0.7693 | 0.2307 |
| Training in Malaria diagnosis | 2.85 | 1.69 | 0.3515 | 0.6485 |
| Training in malaria treatment | 2.72 | 1.65 | 0.3673 | 0.6327 |
| The primary source of medical supplies | 1.55 | 1.25 | 0.645 | 0.355 |
| Principal to manage medical supplies | 1.36 | 1.16 | 0.7378 | 0.2622 |
| Mean VIF | 1.65 |
The analysis of various independent variables that influence the general health facility readiness for malaria diagnosis and treatment using Crude Odds Ratios (COR) and Adjusted Odds Ratios (AOR) was conducted to measure the strength of association between these characteristics and readiness. Statistical significance is indicated by p-values, where values below 0.05 denote significant results.
Key Findings
Health Facility Management- Health facilities managed by the private sector showed lower readiness odds than government-managed facilities (AOR: 0.09, 95% CI: 0.01–0.87), although the result was not statistically significant (p = 0.177). Government-managed facilities served as the reference group with better malaria readiness. Facility Offering Outpatient Department (OPD) Services Only- OPD-only facilities had lower odds of preparedness compared to those providing broader services (AOR: 0.62, 95% CI: 0.27–1.56), but this was not statistically significant (p = 0.307).
Health Facilities receiving government support and attention in malaria treatment and prevention activities were significantly more likely to be ready (AOR: 3.37, 95% CI: 1.42–7.95), with a strong p-value (p = 0.006). Financial backing significantly enhanced readiness, with facilities receiving support showing higher odds (AOR: 2.31, 95% CI: 1.12–4.77) and a statistically significant result (p = 0.024).
Facilities serving communities with high malaria awareness demonstrated better readiness (AOR: 2.91, 95% CI: 1.34–6.30), with statistical significance (p = 0.007). Regular performance review was strongly associated with readiness (AOR: 5.02, 95% CI: 2.39–10.54), showing a highly significant result (p < 0.001). Facilities conducting Active and Passive Surveillance were more likely to be ready (AOR: 1.41, 95% CI: 0.76–2.64), though this was not statistically significant (p = 0.277).
Facilities prescribing malaria treatments had significantly higher readiness (AOR: 3.54, 95% CI: 1.91–6.55) with a p-value of p< 0.001. Facilities with guidelines reported and observed showed higher odds (AOR: 3.74 and 3.61, respectively), though these findings were not statistically significant (p = 0.131, 0.138).
Training staff in malaria diagnosis showed a significant association with readiness (AOR: 1.67, 95% CI: 0.76–3.68; p = 0.033). Training staff in malaria treatment showed no statistical significance (p = 0.220). Facilities reliant on NGO/donor or national medical stores showed better readiness than private suppliers, although the findings were not statistically significant (p = 0.685, 0.119).
The result shows that health facilities employing pharmacists for medical supply management demonstrated significantly higher readiness than those hiring nurses (AOR: 7.2, 95% CI: 2.63–14.6; p = 0.007). Similarly, those employing pharmaceutical technicians showed better odds (AOR: 6.09, 95% CI: 2.32–15.5; p < 0.001). Please see Table 7 for more information on the association of variables.
Table 7: The association of health facility readiness with health system variables
| Category | Characteristics | COR (95%CI) | AOR (95%CI) | P-value |
| HF management | Private | 0.05(0.01, 0.22) | 0.09(0.01, 0.87) | 0.177 |
| Government | 1.00 | 0.307 | ||
| Facility OPD only | Yes | 0.61(0.38, 0.98) | 0.62(0.27, 1.56) | 0.307 |
| No | 1.00 | |||
| Government attention | Yes | 7.14(3.95, 12.91) | 3.37(1.42, 7.95) | 0.006** |
| No | 1.00 | |||
| The community is aware of malaria | Yes | 5.21(3.34, 8.15) | 2.91(1.34, 6.30) | 0.007** |
| No | 1.00 | |||
| Review malaria performance | Yes | 5.53(3.61, 8.46) | 5.02(2.39, 10.54 | <0.001*** |
| No | 1.00 | |||
| Conducts active and passive surveillance | Yes | 2.48(1.71, 3.60) | 1.41(0.76, 2.64) | 0.277 |
| No | 1.00 | |||
| Prescribe malaria treatment | Yes | 3.99(2.69, 5.91) | 3.54(1.91, 6.55) | <0.001*** |
| No | 1.00 | |||
| Availability of malaria guide | Yes, Reported | 2.93(1.19, 7.25) | 3.74(0.67, 20.8) | 0.131 |
| Yes, Observed | 3.67(1.51, 8.94) | 3.61(0.66, 9.74) | 0.138 | |
| Not available | 1.00 | |||
| Staff trained in malaria diagnosis | Yes | 4.84(3.19, 7.35) | 1.67(0.76, 3.68) | 0.033* |
| No | 1.00 | |||
| Staff trained in malaria treatment1 | Yes | 4.75(3.09, 7.32) | 2.97(1.29, 6.87) | 0.220 |
| No | 1.00 | |||
| The main source of medical supplies | NGO/Donors | 5.77(0.67, 49.87) | 2.34(0.04,20.29) | 0.685 |
| National M/store | 2.07(1.33, 3.23) | 1.85(0.85, 4.01) | 0.119 | |
| Private source | 1.00 | |||
| Responsible for medical supplies | Clinical officer | 1.63(0.34, 7.72) | 1.46(0.63,17.23) | 0.127 |
| Pharm. technician | 3.26(1.71, 6.20) | 6.09(2.32, 15.5) | <0.001*** | |
| Pharmacist | 6.79(1.18,39.07) | 7.2(2.63, 14.6) | 0.007* | |
| Nurse | 1.00 |
*p<0.05, ** p<0.01, ***p<0.001
Multivariate analysis was conducted to control for confounding variables that could distort the observed associations. The initial bivariate analysis identified more than ten variables that showed statistical associations with health facility readiness status. However, only seven variables remained statistically significant when adjusted for confounders in the multivariate model, demonstrating a stronger independent effect on the outcome.
This approach allows for a more precise estimation of each variable’s influence while mitigating biases introduced by overlapping effects among predictors. By including multiple covariates in the regression model, the analysis accounts for interdependencies, ensuring that only variables with genuine, independent associations are retained in the final results.
5. Discussion
The readiness of health facilities to diagnose and treat malaria is a critical determinant of effective case management and disease control. Applying the World Health Organization (WHO) health system building blocks framework, this study assesses service delivery, health workforce, information systems, access to essential medicines, financing, and governance to highlight strengths, gaps, and systemic challenges. The study also identifies the determinants or correlated factors contributing to better health facility readiness in the sub-cities.
5.1 Service Delivery: Limited Accessibility and Coverage
The reported rates of conducting blood smear tests onsite, in only 51.5% of health facilities, indicate that the reliance on off-site testing, despite microscopy being the gold standard for malaria diagnosis, could delay case confirmation and treatment initiation, increasing disease burden. The result in using microscopy for malaria testing is closer to the study reported in Ethiopia, where 46% of health facilities conducted malaria microscopy.[14]
It is similar to a study on malaria diagnostic readiness assessment results in Tanzania (55%).[15] This finding is much higher than the availability of microscopic diagnosis in Somalia, which is only 14%.[16] The difference with Somalia may be due to the security issues in Somalia and the different settings in the studies. Similar to the findings in Ethiopia, where 67% performed RDT testing,[17] and in Somalia, where 52% performed RDT testing,[18] Malaria testing using RDT is available in 62.7% of all assessed health facilities. WHO recommends that diagnostic equipment and kits be available at all health facilities to enhance early identification and management of malaria cases.
The small proportion of health facilities (14.8%) providing the WHO-recommended 24-hour service[19] Highlights gaps in structured oversight, where inadequate supervision, with only 24.5% receiving higher-level supervision in the last month, may result in low adherence to malaria protocols, mismanagement of resources, and inefficiencies in service delivery.[20] Furthermore, most health facilities operate only between 9 and 16 hours, limiting access for individuals who may seek malaria diagnosis or treatment outside standard hours. This restricted availability may contribute to delays in treatment-seeking behavior, potentially exacerbating malaria complications.
The general health facility readiness of 41.6% of all visited health facilities is similar to that of Somalia, with an overall malaria readiness of 42%.[21][22] But, it is lower than a study on malaria case management readiness in Madagascar (52%), and lower than the readiness assessment result from Tanzania (62%).[23][24] It may be due to the difference in the study settings and the urban and highland nature of the study area in the current study.
Health facilities providing OPD services were only 40% less likely to be ready to diagnose and treat. This may be related to these facilities lacking the necessary laboratory and medication services to treat severe malaria at the inpatient level.
5.2 Health Workforce: Training Gaps Affecting Diagnostic Readiness
Despite most health facilities having enough proportion of nurses, laboratory technicians, and pharmacists, the limited availability of specialist doctors, in just 22.5% of health facilities, indicates that the majority of the health facilities could not provide specialized malaria services, which is very important to save the lives of severely ill malaria patients. The limited availability of community-level health workers, who are present in only 9.2% of health facilities, limits the role of health facilities in enhancing community-level activities in malaria prevention, including community awareness.
Moreover, staff training in malaria diagnosis was significantly associated with facility readiness (AOR: 4.84), similar to research conducted in Ethiopia on the readiness level of health facilities for communicable disease treatment.[25] The result reinforces that capacity-building efforts should be intensified to improve diagnostic accuracy and treatment protocols. Training gaps among healthcare providers further exacerbate diagnostic inefficiencies.
5.3 Health Information Systems: Data Completeness and Surveillance Gaps
The strong association between routine malaria performance reviews and readiness implies that structured evaluation frameworks help facilities identify gaps, optimize resource allocation, and enhance staff proficiency. Facilities engaging in regular assessments likely develop institutional learning practices, refining their diagnostic and treatment approaches over time.
The relatively higher proportion of facilities analyzing malaria indicators (65%) and monitoring report completeness (68%) signifies a commitment to data-driven decision-making. These metrics ensure that malaria interventions are evidence-based, enabling facilities to respond swiftly to emerging patterns in disease prevalence.
Malaria surveillance is reported in 50.4% of facilities, encompassing active (proactive case detection) and passive (cases presented at facilities) approaches. This proportion suggests that surveillance systems, while present, may require scaling and strengthening to achieve comprehensive coverage. Active surveillance ensures the timely identification of hotspots, while passive surveillance integrates routine healthcare touchpoints in disease monitoring.
5.4 Access to Essential Medicines: Stockouts Hindering Timely Diagnosis and Treatment
The 55.2% availability of ACT, the primary drug of choice for malaria, in a valid form, suggests moderate accessibility. Still, 8.2% of facilities had invalid stocks, indicating potential expiration or quality control failures in supply chains. The 32.8% reporting stockouts and 1.3% of facilities stating ACT was never available highlight critical gaps in medication distribution, potentially undermining malaria treatment effectiveness. The 15.7% of facilities experiencing RDT shortages, with 43.8% reporting stockouts lasting more than 14 days, signal disruptions in early case detection mechanisms.
The results align with studies in the Oromia Special Zone and Southwest Ethiopia, highlighting challenges in poor inventory management, forecasting errors, and long stock-out periods for key antimalarial drugs.[26][27] However, it does not confirm the reports that the Ethiopian Pharmaceutical Supply Agency (EPSA), with 19 regional hubs, has progressed in improving the procurement and distribution of antimalarial commodities to reduce malaria drug stock-outs and ensure commodity availability at the health facility level.[28]
Given WHO’s recommendation for universal diagnostic availability, stockouts significantly impair timely malaria identification, potentially leading to delayed treatment and increased transmission risks. The availability of oral Artemisinin (55.2%) and Artesunate injections/rectal formulations (57.5%) aligns closely with ACT access patterns, reinforcing the systemic nature of malaria treatment distribution challenges. Ensuring treatment access at the point of care requires enhanced forecasting models to mitigate supply shortages and streamlined logistics management.
The 58.4% availability of Sulfadoxine-Pyrimethamine suggests reasonable coverage, yet gaps persist for facilities unable to access the drug. Since SP is vital for intermittent preventive treatment in pregnant women (IPTp), any disruptions could directly affect maternal and neonatal health outcomes, warranting targeted interventions for pregnant women in malaria-endemic regions.
The availability of Insecticide-Treated Nets (ITNs) for patients at 62.2% indicates relatively strong accessibility, but room for improvement in distribution coverage. ITNs remain central to malaria prevention strategies, so ensuring consistent availability across facilities, especially in high-transmission areas, is vital for long-term malaria reduction efforts despite the challenges in the utilization of ITNs, such as suboptimal utilization due to cultural practices, misuse of nets, and limited community engagement.[29][30]. The association between pharmacists managing medical supplies and improved facility readiness suggests that expertise in pharmaceutical logistics enhances malaria case management. Compared to nurses, pharmacists bring specialized procurement and inventory oversight skills, ensuring optimal stock levels and medication integrity.
5.5 Financing: Strong Government Support Enhances Preparedness
The strong correlation between financial backing and malaria preparedness suggests that funding is not merely an operational necessity but a strategic enabler. Facilities with sustained financial resources likely benefit from consistent supply chains for medications and diagnostic tools, workforce stability, ensuring trained personnel remain engaged in malaria case management, and capacity-building programs that refine malaria intervention strategies. The striking 6.13 times greater preparedness reinforces that budget allocations and donor investments directly influence the effectiveness of malaria control efforts.
The fact that only 63.9% of facilities provide free malaria services for the poor raises concerns about health equity in providing malaria services. This gap suggests economic barriers may prevent vulnerable populations from seeking timely diagnosis and treatment, and free malaria care is not universally embedded within health systems. This limited provision risks excluding marginalized communities, potentially leading to a higher disease burden among economically disadvantaged groups.
5.6 Leadership and Governance: Policy Influence on Readiness
The fact that 80.9% of health facilities received government attention and were 7.14 times more likely to be prepared suggests that centralized support plays an essential role in malaria control. Government involvement likely ensures timely resource allocation, including funding and equipment, stronger health system coordination, allowing for consistent policy enforcement, and national prioritization of malaria interventions, reinforcing facility-level efforts. However, the low frequency of higher-level supervision (24.5% in the last month) raises concerns about inconsistent oversight. Quality control gaps may emerge without regular monitoring, affecting service delivery and supply chain management.
Facilities in communities aware of malaria prevention and treatment were 5.21 times more likely to be ready, indicating that public engagement strengthens health facility effectiveness. Awareness fosters increased health-seeking behavior, ensuring early diagnosis and treatment, improved adherence to prevention measures, such as ITN use and vector control, and community-driven accountability, where informed populations demand accessible services. Facilities in unaware communities may face lower patient engagement, delayed treatment-seeking, and weaker public health response to outbreaks, reinforcing the need for education campaigns.
Ethiopia’s National Malaria Strategic Plan (NMSP 2021–2025) has articulated clear goals, including the universal availability of diagnostics and coverage of vector control. Yet, readiness scores at the facilities in Addis Ababa fall well below several of these benchmarks. For example, 41.6% of facilities were adequately prepared overall, falling well short of the NMSP target of 80% for malaria-endemic districts. In addition, diagnostic stock-outs and service hours were inconsistent, indicating implementation coverage cannot be generalized at the district level. There is minimal evidence of sub-city adaptation of national protocols.
Table 8 presents the policy audit of the national strategic plan versus health facility readiness in Addis Ababa sub-cities.
The following matrix shows the Policy Audit of National Malaria Strategic Plan benchmarks vs. Addis Ababa health facility readiness.
Table 8: National Malaria Strategic Plan benchmarks vs. Addis Ababa health facility readiness.
| Readiness Indicator | NMSP 2025 Target | Observed Field-Level Performance (Addis Sample) | Gap | Key Strategic Gaps |
| Malaria diagnostic availability (RDT or microscopy) | 100% coverage across all health facilities | 69.9% | 30.1% | Limited access to microscopy in lower-tier facilities; RDT stock-outs reported in 15.7% of sites |
| Treatment commodity availability (ACT, IV support) | Continuous availability without stock-out | 52.6% | 47.4% | Frequent ACT stock-outs; weak inventory protocols in health facilities |
| Trained staff on malaria diagnosis & treatment | ≥85% of providers trained | 36.3% (diagnosis); 33% (treatment) | -49% avg | Limited refresher training; staff turnover in private and peripheral facilities |
| Operational hours (24-hour malaria services | ≥80% of high-risk facilities | 14.8% offer 24-hour coverage | 65.2% | Emergency response gaps in the majority of facilities |
| Surveillance & performance review practices | ≥90% of facilities engaged | 65.0% monitor indicators | 25% | Irregular supervision |
| Diagnostic stock-out incidence | ≤5% experience RDT stock-outs quarterly | 15.7% reported recent stock-outs | +10.7% over cap | Weak contingency planning; inadequate supply chain coordination |
| Donor architecture utilization (Global Fund, USAID) | Strategic alignment and co-financing for malaria readiness | No localized engagement observed | Structural gap | Absence of district-level funding compacts or urban highland targeting |
Discussion of Observational Findings
Human Resources for Malaria Services: Although many health facilities have a mix of health professionals, many health facilities in Addis Ababa do not have malaria-dedicated personnel due to historically low caseloads. Staff turnover and work overload are common, which may lead to inconsistent skill retention for malaria case management. Health workers have limited recent training in malaria diagnosis and treatment protocols, especially in clinics and health centers that do not routinely see cases.
Patients report delays in receiving care when presenting with fever, as some health professionals are not alert to the possibility of malaria in urban settings. Health workers treat patients for diseases such as typhoid, typhus, and other febrile illnesses before suspecting malaria.
Leadership and Governance: Malaria was not a strategic priority for many health facility managers until recently, in the last two years. Malaria case management structures exist for common infectious disease management, but malaria is often overlooked unless outbreaks occur, such as the increased cases in 2023. Decision-makers may not allocate sufficient resources for malaria surveillance and response in urban kebeles.
Infrastructure: Observation of health facilities indicates that many have better physical infrastructure, but not always tailored for infectious disease management. Malaria diagnosis rooms are together with other communicable diseases in many facilities, and there are no dedicated fever/malaria examination rooms or triage systems. Some facilities have laboratory space but lack specialized diagnostic equipment such as microscopes or well-maintained RDT storage, especially in the clinics. Patients overcrowding in general outpatient areas and long waiting times for diagnostic services were observed.
Malaria Diagnosis and Treatment: Rapid Diagnostic Tests (RDTs) are available in most public health centers, but most private health facilities report unavailability of the tests. Microscopy is available in larger hospitals, but technicians often lack recent experience with malaria slides. Treatment protocols using ACTs (artemisinin-based combination therapies) are known to clinicians.
Clinicians still report a low suspicion rate of malaria, and some febrile patients report being sent home with only paracetamol, without malaria testing, unless they insist or mention travel history.
Medicines and Supplies: Anti-malarial medicines are available through the government supply chain, but stock-outs occasionally occur due to low perceived demand and supply chain prioritization elsewhere. Health posts and clinics may not stock all recommended treatments, such as primaquine and other antimalarial medications. Patients sometimes report needing to purchase drugs at private pharmacies due to unavailability or delays in public facilities.
Logistics and Supply Chain: Health facilities rely on the national Pharmaceutical Fund and Supply Agency (PFSA), prioritizing high-transmission areas. There are delays in restocking malaria RDTs and medicines when urban demand increases unexpectedly. Cold chain management for RDTs and drug storage is adequate in hospitals but weak in smaller health posts. Patients in peripheral urban areas note inconsistent service availability depending on the facility visited, leading to confusion and dissatisfaction.
While Addis Ababa’s health facilities are relatively well-resourced compared to rural areas, malaria-specific readiness remains suboptimal due to low prioritization, undertrained staff, and understocked supplies. From the patients’ perspective, there is a gap in awareness, responsiveness, and diagnostic diligence. Integrating malaria preparedness into the broader urban health strategy is essential, with increasing urban vulnerability to malaria, mainly due to climate shifts and urban agriculture.
Limitations: The health facility readiness assessment was based on the reports provided by the respective individuals in the respective facilities and the relevant authorities in their field. Although the assessment observes some components, sections without observation may have been affected by the subjective influence and background of the respondent on the reporting accuracy of health system variables.
6. Conclusion and Recommendations
This facility-based assessment highlights significant health system deficiencies in malaria diagnostic and treatment preparedness across urban highland settings in Addis Ababa. Despite national efforts toward malaria elimination, only 41.6% of surveyed health facilities met the general readiness threshold, underscoring widespread gaps in infrastructure, workforce training, commodity availability, and operational continuity. Facilities that benefited from closer government engagement and routine performance reviews exhibited notably higher readiness scores, reinforcing the critical role of institutional stewardship and resource coordination. The findings point to an emerging vulnerability in highland sub-cities, where climate change, population movement, and health system constraints intersect to elevate malaria transmission risks.
Ethiopia and IGOs must prioritize a multi-tiered reform strategy to address these systemic gaps and strengthen health facility capacity in climatically sensitive urban zones. Key actions should include: expanding targeted workforce training on malaria diagnosis and case management; developing district-level readiness dashboards linked to National Malaria Strategic Plan (NMSP) indicators; and establishing funding compacts with international partners such as the Global Fund, USAID, and UNDP to stabilize commodity pipelines and scale surveillance platforms.
Governance reforms should promote decentralization of malaria response resources, empowering district health authorities to tailor interventions to local transmission dynamics. Additionally, improving procurement and logistics coordination between national and sub-city bureaus is essential to reducing diagnostic and treatment stockouts. Climate-responsive surveillance systems integrating meteorological data must be operationalized, alongside early warning tools for climate-driven outbreak detection. Finally, sustained investment in applied research, multisectoral surveillance integration, and regulatory oversight is crucial to align urban malaria readiness with WHO health system standards.
7. Acknowledgement
The author acknowledges the support of Dr. Zerai Hagos for his invaluable guidance and comprehensive review during the preparation of the dissertation process from which this article was published.
- Conflict of Interest
The author declares that there is no conflict of interest.
9. References
Acharya, Kiran, Navaraj Bhattarai, Rudra Dahal, et al. “Examining the Availability and Readiness of Health Facilities to Provide Cervical Cancer Screening Services in Nepal: A Cross-Sectional Study Using Data from the Nepal Health Facility Survey.” BMJ Open 14, no. 7 (2024): e077537. https://doi.org/10.1136/bmjopen-2023-077537.
Ahmad, Nurhafizah, Fadzilawani Astifar Alias, Muniroh Hamat, and Siti Asmah Mohamed. RELIABILITY ANALYSIS: APPLICATION OF CRONBACH’S ALPHA IN RESEARCH INSTRUMENTS. 2024.
Altaras, Robin, Matt Worges, Sabrina La Torre, et al. “Outreach Training and Supportive Supervision for Quality Malaria Service Delivery: A Qualitative Evaluation in 11 Sub-Saharan African Countries.” The American Journal of Tropical Medicine and Hygiene 110, no. 3_Suppl (2024): 20–34. https://doi.org/10.4269/ajtmh.23-0316.
Anand, Anjoli, Rachel Favero, Catherine Dentinger, et al. “Malaria Case Management and Elimination Readiness in Health Facilities of Five Districts of Madagascar in 2018.” Malaria Journal 19, no. 1 (2020): 351. https://doi.org/10.1186/s12936-020-03417-z.
Aragie, Tsigie Baye. “Knowledge of Malaria Prevention and Control Methods and Associated Factors among Rural Households in West Belessa District, North West Ethiopia, 2019.” BMC Public Health 20, no. 1 (2020): 1275. https://doi.org/10.1186/s12889-020-09332-x.
Asale, Abebe, Zewdu Abro, Bayu Enchalew, et al. “Community Knowledge, Perceptions, and Practices Regarding Malaria and Its Control in Jabi Tehnan District, Amhara Region, Northwest Ethiopia.” Malaria Journal 20, no. 1 (2021): 459. https://doi.org/10.1186/s12936-021-03996-5.
Asmamaw, Getahun, Tefera Minwagaw, Mastewal Samuel, and Wondim Ayenew. “Availability and Readiness of Health Facilities Providing Services for Other Infectious Diseases to Treat Neglected Tropical Diseases in Ethiopia: Implications for Service Integration in High Burden Areas.” BMC Health Services Research 24, no. 1 (2024): 850. https://doi.org/10.1186/s12913-024-11257-9.
CSA-Ethiopia. “Population of Zones and Weredas Projected as of July 2023.” Addis Ababa: CSA, 2023.
Gari, Taye, and Bernt Lindtjørn. “Reshaping the Vector Control Strategy for Malaria Elimination in Ethiopia in the Context of Current Evidence and New Tools: Opportunities and Challenges.” Malaria Journal 17, no. 1 (2018): 454. https://doi.org/10.1186/s12936-018-2607-8.
Mahase, Elisabeth. “Malaria: Drug Resistance and Fragile Health Systems Are Hindering Progress, WHO Warns.” BMJ (Clinical Research Ed.) 387 (December 2024): q2776. https://doi.org/10.1136/bmj.q2776.
Mengesha, Haile Yirga, Getachew Moges Gebrehiwot, Birhanu Demeke Workneh, and Mesfin Haile Kahissay. “Practices of Anti-Malaria Pharmaceuticals Inventory Control System and Associated Challenges in Public Health Facilities of Oromiya Special Zone, Amhara Region, Ethiopia.” BMC Public Health 21, no. 1 (2021): 2026. https://doi.org/10.1186/s12889-021-12033-8.
Ministry of Health- Ethiopia. Ethiopian Health Sector Transformation Plan II (2020/21- 2024/25). Addis Ababa, Ethiopia: MOH, 2021.
Ministry of Health- Ethiopia. Health Information System Strategic Plan 2020/21-2024/25. Addis Ababa, Ethiopia: MOH, 2019.
Ministry of Health- Somalia. “Service Availability and Readiness Assessment 2016: Summary Report.” MOH Somalia, 2016.
Ministry of Health- Tanzania. “Service Availability and Readiness Assessment.” MOH Tanzania, 2023.
Molla, Gebeyaw, Theodros Getachew, Atkure Defar, et al. “Determinant of Malaria Service Readiness at Health Facility: Evidence from 2018 Service Availability and Readiness Assessment: Cross-Sectional Study.” Preprint, November 28, 2019. https://doi.org/10.21203/rs.2.17893/v1.
Paaijmans, Krijn P., and Neil F. Lobo. “Gaps in Protection: The Actual Challenge in Malaria Elimination.” Malaria Journal 22, no. 1 (2023): 46. https://doi.org/10.1186/s12936-023-04473-x.
Pallant, Julie. SPSS Survival Manual: A Step-by-Step Guide to Data Analysis Using IBM SPSS. Sixth. Open University Press, McGraw-Hill Education, McGraw-Hill House, 2016.
Research-Methodology. “Research Reliability.” Accessed September 24, 2024. https://research-methodology.net/research-methodology/reliability-validity-and-repeatability/research-reliability/.
Ssempiira, Julius, Ibrahim Kasirye, John Kissa, et al. “Measuring Health Facility Readiness and Its Effects on Severe Malaria Outcomes in Uganda.” Scientific Reports 8, no. 1 (2018): 17928. https://doi.org/10.1038/s41598-018-36249-8.
stataiml. “Thresholds for Detecting Multicollinearity.” Stataiml, July 2, 2024. https://stataiml.com/posts/60_multicollinearity_threshold_ml/.
Tessema, Alemayehu Tadesse, Amene Tesfaye Ayane, and Nasir Tajure Wabe. “Indicator-Based Assessment on Antimalarial Drug Availability and Utilization Among Selected Public Health Facilities in Southwest Ethiopia.” Drug Information Journal 46, no. 5 (2012): 587–92. https://doi.org/10.1177/0092861512452122.
World Health Organization. “10 Ways to Improve the Quality of Care in Health Facilities.” Accessed April 20, 2025. https://www.who.int/news-room/feature-stories/detail/10-ways-to-improve-the-quality-of-care-in-health-facilities.
[1] Ministry of Health- Ethiopia, Ethiopian Health Sector Transformation Plan II (2020/21- 2024/25) (Addis Ababa, Ethiopia: MOH, 2021), 15.
[2] CSA-Ethiopia, “Population of Zones and Weredas Projected as of July 2023,” Addis Ababa: CSA, 2023, 31.
[3] Ministry of Health- Ethiopia, Ethiopian Health Sector Transformation Plan II (2020/21- 2024/25), 15.
[4] Ministry of Health- Ethiopia, Ethiopian Health Sector Transformation Plan II (2020/21- 2024/25), 26–27.
[5] Krijn P. Paaijmans and Neil F. Lobo, “Gaps in Protection: The Actual Challenge in Malaria Elimination,” Malaria Journal 22, no. 1 (2023): 2–3, https://doi.org/10.1186/s12936-023-04473-x.
[6] Anjoli Anand et al., “Malaria Case Management and Elimination Readiness in Health Facilities of Five Districts of Madagascar in 2018,” Malaria Journal 19, no. 1 (2020): 7–9, https://doi.org/10.1186/s12936-020-03417-z.
[7] Julius Ssempiira et al., “Measuring Health Facility Readiness and Its Effects on Severe Malaria Outcomes in Uganda,” Scientific Reports 8, no. 1 (2018): 10, https://doi.org/10.1038/s41598-018-36249-8.
[8] Robin Altaras et al., “Outreach Training and Supportive Supervision for Quality Malaria Service Delivery: A Qualitative Evaluation in 11 Sub-Saharan African Countries,” The American Journal of Tropical Medicine and Hygiene 110, no. 3_Suppl (2024): 31–32, https://doi.org/10.4269/ajtmh.23-0316.
[9] Elisabeth Mahase, “Malaria: Drug Resistance and Fragile Health Systems Are Hindering Progress, WHO Warns,” BMJ (Clinical Research Ed.) 387 (December 2024): q2776, https://doi.org/10.1136/bmj.q2776.
[10] “Research Reliability,” Research-Methodology, accessed September 24, 2024, https://research-methodology.net/research-methodology/reliability-validity-and-repeatability/research-reliability/.
[11] Nurhafizah Ahmad et al., RELIABILITY ANALYSIS: APPLICATION OF CRONBACH’S ALPHA IN RESEARCH INSTRUMENTS, 2024, 116.
[12] Julie Pallant, SPSS Survival Manual: A Step-by-Step Guide to Data Analysis Using IBM SPSS, Sixth (Open University Press McGraw-Hill Education McGraw-Hill House, 2016), 3.
[13] stataiml, “Thresholds for Detecting Multicollinearity,” Stataiml, July 2, 2024, https://stataiml.com/posts/60_multicollinearity_threshold_ml/.
[14] Gebeyaw Molla et al., “Determinant of Malaria Service Readiness at Health Facility: Evidence from 2018 Service Availability and Readiness Assessment: Cross Sectional Study,” preprint, November 28, 2019, 10, https://doi.org/10.21203/rs.2.17893/v1.
[15] Ministry of Health- Tanzania, “Service Availability and Readiness Assessment,” MOH Tanzania, 2023, 44.
[16] Ministry of Health- Somalia, “Service Availability and Readiness Assessment 2016: Summary Report,” MOH Somalia, 2016, 163.
[17] Molla et al., “Determinant of Malaria Service Readiness at Health Facility,” 10.
[18] Ministry of Health- Somalia, “Service Availability and Readiness Assessment 2016: Summary Report,” 163.
[19] World Health Organization, “10 Ways to Improve the Quality of Care in Health Facilities,” accessed April 20, 2025, https://www.who.int/news-room/feature-stories/detail/10-ways-to-improve-the-quality-of-care-in-health-facilities.
[20] Ministry of Health- Ethiopia, Health Information System Strategic Plan 2020/21-2024/25 (Addis Ababa, Ethiopia: MOH, 2019), 50.
[21] Ministry of Health- Somalia, “Service Availability and Readiness Assessment 2016: Summary Report,” 164.
[22] Kiran Acharya et al., “Examining the Availability and Readiness of Health Facilities to Provide Cervical Cancer Screening Services in Nepal: A Cross-Sectional Study Using Data from the Nepal Health Facility Survey,” BMJ Open 14, no. 7 (2024): 8, https://doi.org/10.1136/bmjopen-2023-077537.
[23] Anand et al., “Malaria Case Management and Elimination Readiness in Health Facilities of Five Districts of Madagascar in 2018,” 7.
[24] Ministry of Health- Tanzania, “Service Availability and Readiness Assessment,” 44.
[25] Getahun Asmamaw et al., “Availability and Readiness of Health Facilities Providing Services for Other Infectious Diseases to Treat Neglected Tropical Diseases in Ethiopia: Implications for Service Integration in High Burden Areas,” BMC Health Services Research 24, no. 1 (2024): 13, https://doi.org/10.1186/s12913-024-11257-9.
[26] Alemayehu Tadesse Tessema et al., “Indicator-Based Assessment on Antimalarial Drug Availability and Utilization Among Selected Public Health Facilities in Southwest Ethiopia,” Drug Information Journal 46, no. 5 (2012): 587–92, https://doi.org/10.1177/0092861512452122.
[27] Taye Gari and Bernt Lindtjørn, “Reshaping the Vector Control Strategy for Malaria Elimination in Ethiopia in the Context of Current Evidence and New Tools: Opportunities and Challenges,” Malaria Journal 17, no. 1 (2018): 7, https://doi.org/10.1186/s12936-018-2607-8.
[28] Haile Yirga Mengesha et al., “Practices of Anti-Malaria Pharmaceuticals Inventory Control System and Associated Challenges in Public Health Facilities of Oromiya Special Zone, Amhara Region, Ethiopia,” BMC Public Health 21, no. 1 (2021): 14, https://doi.org/10.1186/s12889-021-12033-8.
[29] Abebe Asale et al., “Community Knowledge, Perceptions, and Practices Regarding Malaria and Its Control in Jabi Tehnan District, Amhara Region, Northwest Ethiopia,” Malaria Journal 20, no. 1 (2021): 11, https://doi.org/10.1186/s12936-021-03996-5.
[30] Tsigie Baye Aragie, “Knowledge of Malaria Prevention and Control Methods and Associated Factors among Rural Households in West Belessa District, North West Ethiopia, 2019,” BMC Public Health 20, no. 1 (2020): 6, https://doi.org/10.1186/s12889-020-09332-x.